This website is the digital version of the 2014 National Climate Assessment, produced in collaboration with the U.S. Global Change Research Program.

For the official version, please refer to the PDF in the downloads section. The downloadable PDF is the official version of the 2014 National Climate Assessment.

Credits | Site Map

Search Options

X

Search form

Top

Welcome to the National Climate Assessment

The National Climate Assessment summarizes the impacts of climate change on the United States, now and in the future.

A team of more than 300 experts guided by a 60-member Federal Advisory Committee produced the report, which was extensively reviewed by the public and experts, including federal agencies and a panel of the National Academy of Sciences.

Explore the effects of climate change
United States Global Change Research Program logo
United States Department of Agriculture logo United States Department of Commerce logo United States Department of Defense logo United States Department of Energy logo United States Department of Health and Human Services logo United States Department of the Interior logo United States Department of State logo United States Department of Transportation logo United States Environmental Protection Agency logo National Aeronautics and Space Administration logo National Science Foundation logo Smithsonian Institution logo United States Agency for International Development logo

Energy, Water, and Land Use

Climate change affects energy, water, and land use as well as the interactions among these sectors. The combination of these factors affects climate change vulnerability as well as adaptation and mitigation options.

Explore climate change impacts on the intersections of energy, water, and land use.

Next

Convening Lead Authors

Kathy Hibbard, Pacific Northwest National Laboratory

Tom Wilson, Electric Power Research Institute

Lead Authors

Elena Shevliakova, Princeton University

Kristen Averyt, University of Colorado Boulder

Robert Harriss, Environmental Defense Fund

Robin Newmark, National Renewable Energy Laboratory

Steven Rose, Electric Power Research Institute

Vincent Tidwell, Sandia National Laboratories

Introduction

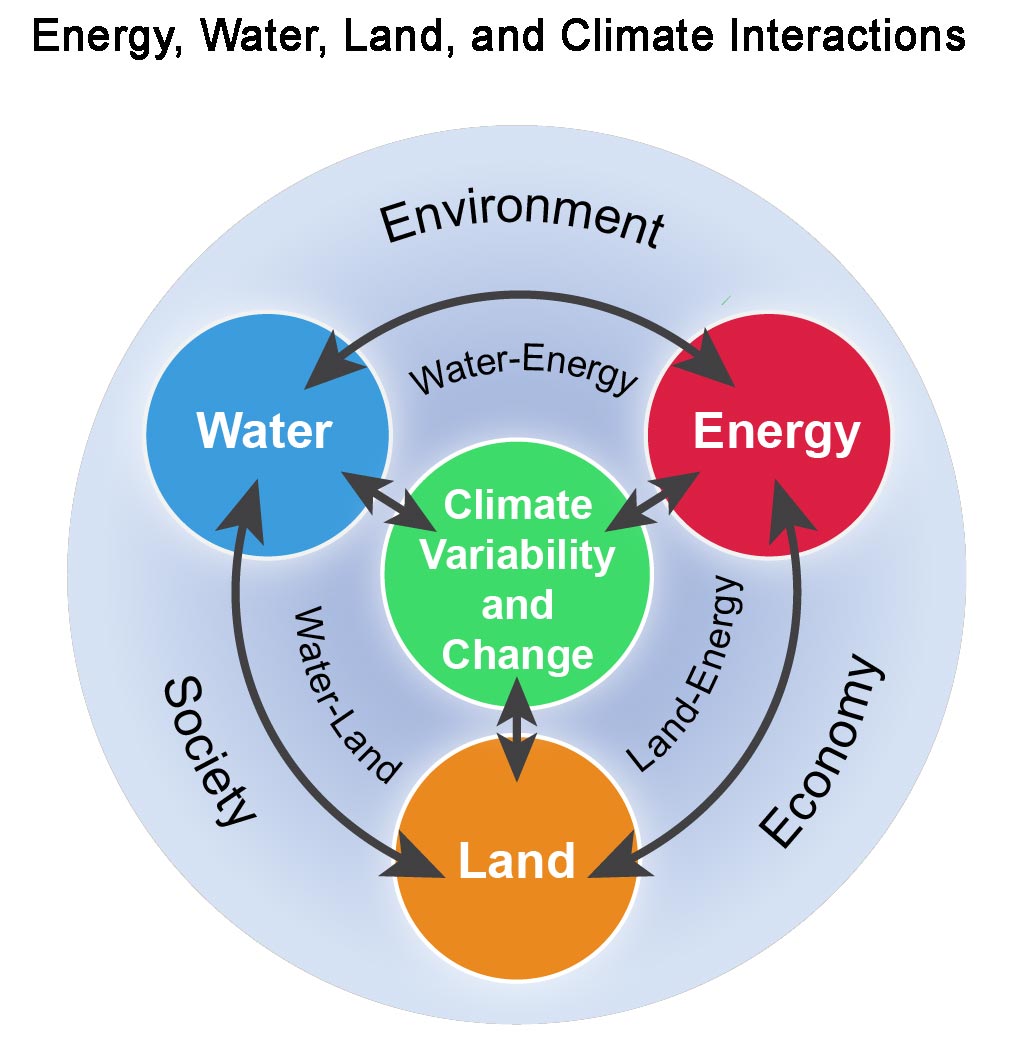
Energy, water, and land systems interact in many ways. Energy projects (energy production and delivery) require varying amounts of water and land; water projects (water supply and irrigation) require energy and land; and land-based activities (agriculture and forestry) depend upon energy and water. Increasing population and a growing economy intensify these interactions.1 Each sector is directly impacted by the others and by climate change, and each sector is a target for adaptation and mitigation efforts. Better understanding of the connections between and among energy, water, and land systems can improve our capacity to predict, prepare for, and mitigate climate change.

Figure 10.1: Energy, Water, Land, and Climate Interactions Energy, Water, Land, and Climate Interactions Details/Download

Challenges from climate change will arise from long-term, gradual changes, such as sea level rise, as well as from projected changes in weather extremes that have more sudden impacts. The independent implications of climate change for the energy, water, and land sectors have been studied extensively (see Ch. 4: Energy, Ch. 3: Water, and Ch. 13: Land Use & Land Cover Change). However, there are few analyses that capture the interactions among and competition for resources within these three sectors.1 Very little information is available to evaluate the implications for decision-making and planning, including legal, social, political, and other decisions.

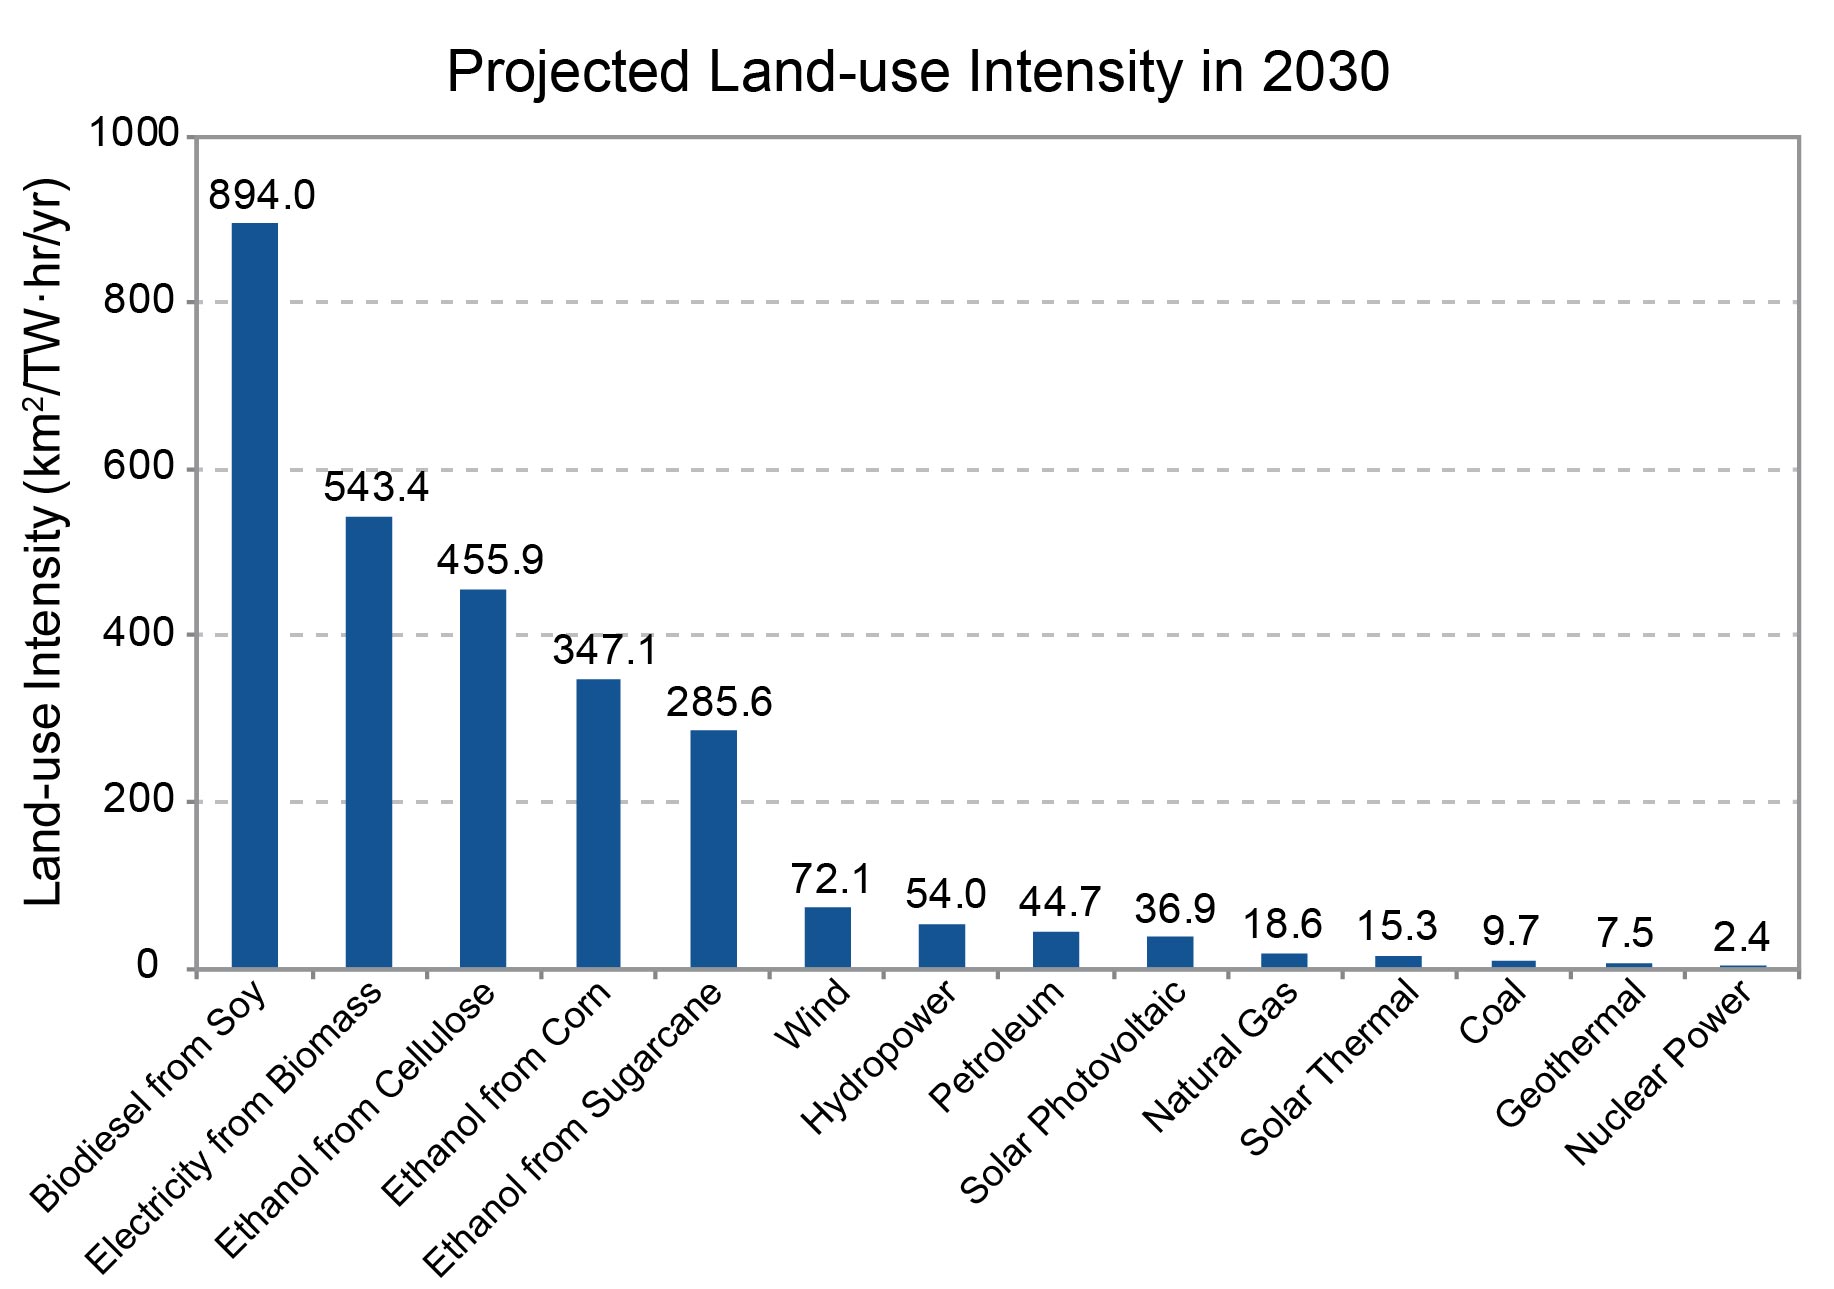
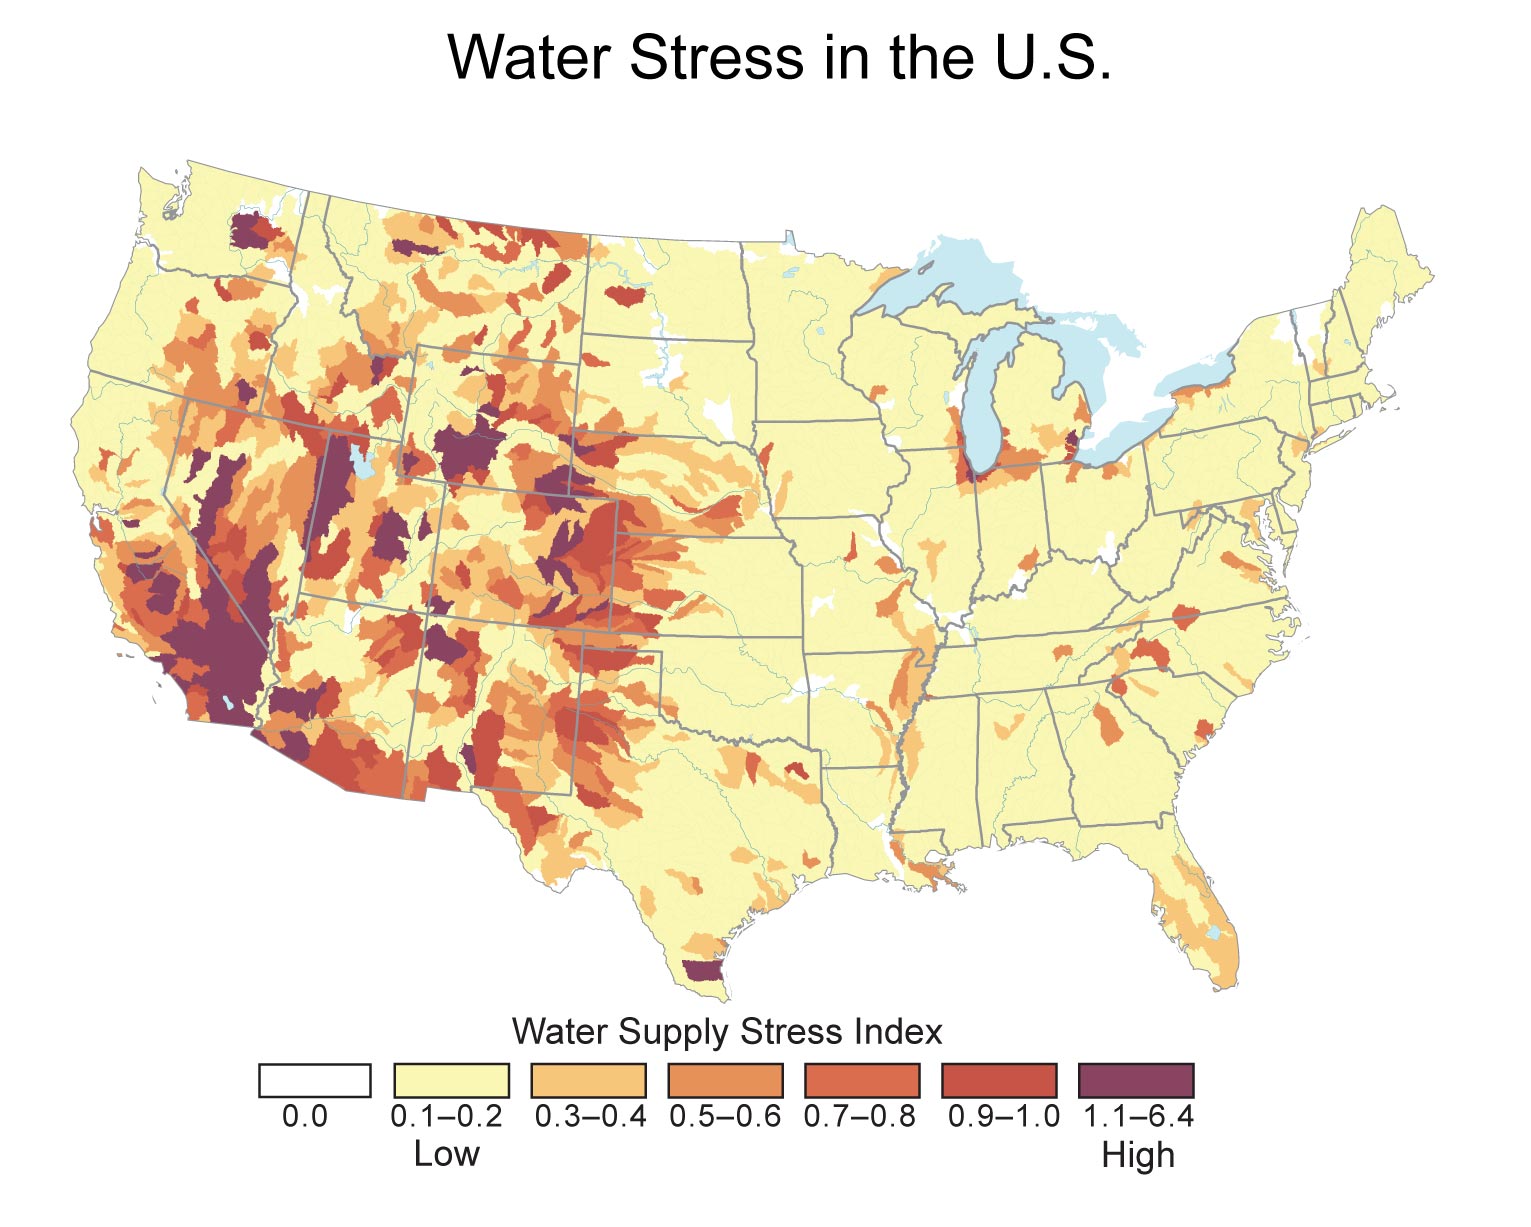
Climate change is not the only factor driving changes. Other environmental and socioeconomic stressors interact with climate change and affect vulnerability and response strategies with respect to energy, water, and land systems. The availability and use of energy, water, and land resources and the ways in which they interact vary across the nation. Regions in the United States differ in their 1) energy mix (solar, wind, coal, geothermal, hydropower, nuclear, natural gas, petroleum, ethanol); 2) observed and projected precipitation and temperature patterns; 3) sources and quality of available water resources (for example, ground, surface, recycled); 4) technologies for storing, transporting, treating and using water; and 5) land use and land cover (see Ch. 13: Land Use & Land Cover Change). Decision-making processes for each sector also differ, and decisions often transcend scales, from local to state to federal, meaning that mitigation and adaptation options differ widely.

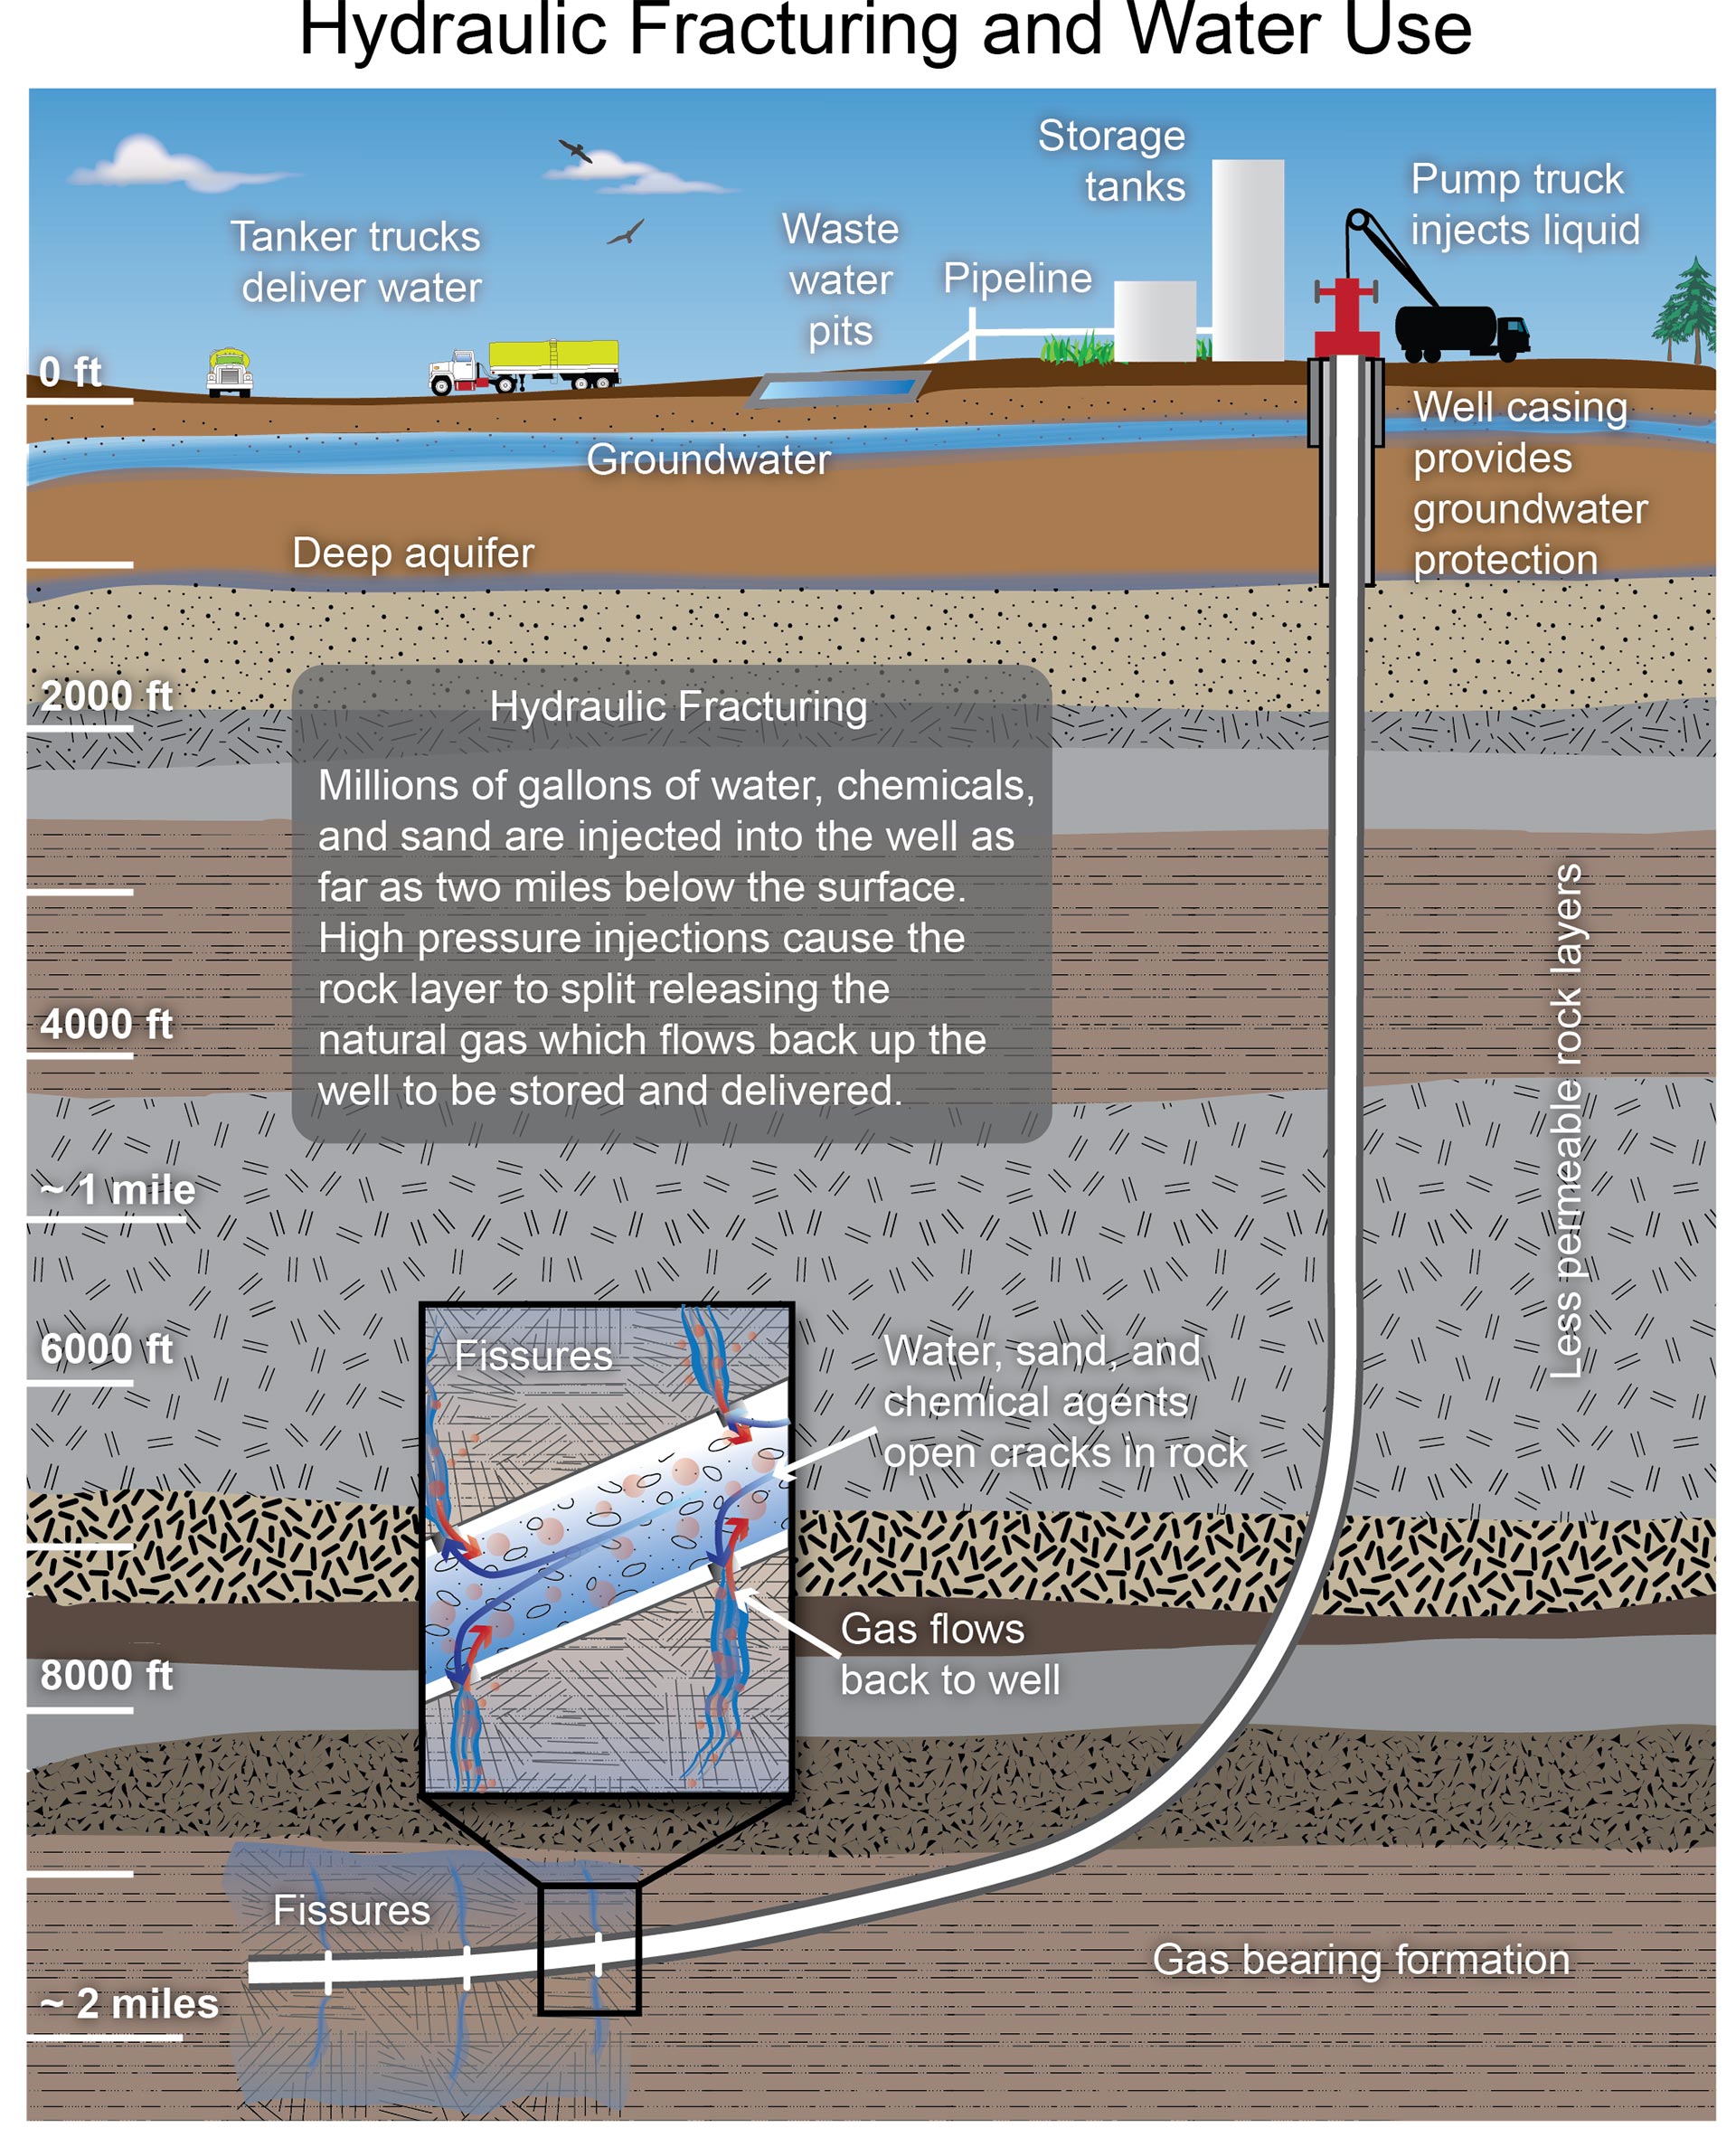
Given the many mitigation and adaptation opportunities available through the energy sector, a focus on energy is a useful way to highlight the interactions among energy, water, and land as well as intersections with climate and other stressors. For example, energy production already competes for water resources with agriculture, direct human uses, and natural systems. Climate-driven changes in land cover and land use are projected to further affect water quality and availability, increasing the competition for water needed for energy production. In turn, diminishing water quality and availability means that there will be a need for more energy to purify water and more infrastructure on land to store and distribute water. Stakeholders need to understand the interconnected nature of climate change impacts, and the value of assessments would be improved if risks and vulnerabilities were evaluated from a cross-sector standpoint.66

Key Message 1: Cascading Events

Energy, water, and land systems interact in many ways. Climate change affects the individual sectors and their interactions; the combination of these factors affects climate change vulnerability as well as adaptation and mitigation options for different regions of the country.

Supporting Evidence
close

Supporting Evidence

Process for Developing Key Messages:

The authors met for a one-day face-to-face meeting, and held teleconferences approximately weekly from March through August 2012. They considered a variety of technical input documents, including a Technical Input Report prepared through an interagency process,1 and 59 other reports submitted through the Federal Register Notice request for public input. The key messages were selected based on expert judgment, derived from the set of examples assembled to demonstrate the character and consequences of interactions among the energy, water, and land resource sectors.

Description of evidence base

The key message and supporting text summarizes extensive evidence documented in the Technical Input Report (TIR): Climate and Energy-Water-Land System Interactions: Technical Report to the U.S. Department of Energy in Support of the National Climate Assessment.1 Technical input reports (59) on a wide range of topics were also received and reviewed as part of the Federal Register Notice solicitation for public input.

The TIR1 incorporates the findings of a workshop, convened by the author team, of experts and stakeholders. The TIR summarizes numerous examples of interactions between specific sectors, such as energy and water or water and land use. A synthesis of these examples provides insight into how climate change impacts the interactions between these sectors.

The TIR1 shows that the character and significance of interactions among the energy, water, and land resource sectors vary regionally. Additionally, the influence of impacts on one sector for the other sectors will depend on the specific impacts involved. Climate change impacts will affect the interactions among sectors, but this may not occur in all circumstances.

The key message is supported by the National Climate Assessment Climate Scenarios (for example, Kunkel et al. 20132). Many of the historic trends included in the Climate Scenarios are based on data assembled by the Cooperative Observer Network of the National Weather Service (http://www.nws.noaa.gov/om/coop/). Regional climate outlooks are based on the appropriate regional chapter.

The Texas drought of 2011 and 2012 provides a clear example of cascading impacts through interactions among the energy, water, and land resource sectors.3,4,5,6,7,8 The U.S. Drought Monitor (http://droughtmonitor.unl.edu/) provides relevant historical data. Evidence also includes articles appearing in the public press9 and Internet media.10

New information and remaining uncertainties

The Texas drought of 2011 and 2012 demonstrates the occurrence of cascading impacts involving the energy, land, and water sectors; however, the Texas example cannot be generalized to all parts of the country or to all impacts of climate change (for example, see Chapter 3 for flooding and energy system impacts). The Technical Input Report1 provides numerous additional examples and a general description of interactions that underlie cascading impacts between these resource sectors.

There are no major uncertainties regarding this key message. There are major uncertainties, however, in the magnitude of impacts in how decisions in one sector might affect another. The intensity of interactions will be difficult to assess under climate change.

Assessment of confidence based on evidence

Given the evidence base and remaining uncertainties, confidence is high. The primary limitation on the confidence assigned to this key message is with respect to its generality. The degree of interactions among the energy, water, and land sectors varies regionally as does the character and intensity of climate change.

Confidence Level

Very High

Strong evidence (established theory, multiple sources, consistent results, well documented and accepted methods, etc.), high consensus

High

Moderate evidence (several sources, some consistency, methods vary and/or documentation limited, etc.), medium consensus

Medium

Suggestive evidence (a few sources, limited consistency, models incomplete, methods emerging, etc.), competing schools of thought

Low

Inconclusive evidence (limited sources, extrapolations, inconsistent findings, poor documentation and/or methods not tested, etc.), disagreement or lack of opinions among experts

Cascading Events

Figure 10.2: Coast-to-Coast 100-degree Days in 2011 Coast-to-Coast 100-degree Days in 2011 Details/Download

Energy production, land use, and water resources are linked in increasingly complex ways. In some parts of the country, electric utilities and energy companies compete with farmers and ranchers, other industries, and municipalities for water rights and availability, which are also constrained by interstate and international commitments. Private and public sector decision-makers must consider the impacts of strained water supplies on agricultural, ecological, industrial, urban, and public health needs. Across the country, these intertwined sectors will witness increased stresses due to climate changes that are projected to lower water quality and/or quantity in many regions and change heating and cooling electricity demands.

The links between and among energy, water, and land sectors mean that they are susceptible to cascading effects from one sector to the next. An example is found in the drought and heat waves experienced across much of the U.S. during the summers of 2011 and 2012. In 2011, drought spread across the south-central U.S., causing a series of energy, water, and land impacts that demonstrate the connections among these sectors. Texans, for example, experienced the hottest and driest summer on record. Summer average temperatures were 5.2°F higher than normal, and precipitation was lower than previous records set in 1956. The associated heat wave, with temperatures above 100°F for 40 consecutive days, together with drought, strained the region’s energy and water resources.3,4,5

Figure 10.3: Texas Summer 2011: Record Heat and Drought Texas Summer 2011: Record Heat and Drought Details/Download

These extreme climate events resulted in cascading effects across energy, water, and land systems. High temperatures caused increased demand for electricity for air conditioning, which corresponded to increased water withdrawal and consumption for electricity generation. Heat, increased evaporation, drier soils, and lack of rain led to higher irrigation demands, which added stress on water resources required for energy production. At the same time, low-flowing and warmer rivers threatened to suspend power plant production in several locations, reducing the options for dealing with the concurrent increase in electricity demand.

The impacts on land resources and land use were dramatic. Drought reduced crop yields and affected livestock, costing Texas farmers and ranchers more than $5 billion, a 28% loss compared to average revenues of the previous four years.10 With increased feed costs, ranchers were forced to sell livestock at lower profit. Drought increased tree mortality,6 providing more fuel for record wildfires that burned 3.8 million acres (an area about the size of Connecticut) and destroyed 2,763 homes.7

Energy, water, and land interactions complicated and amplified the direct impacts on the electric sector. With electricity demands at all-time highs, water shortages threatened more than 3,000 megawatts of generating capacity – enough power to supply more than one million homes.8 As a result of the record demand and reduced supply, marginal electricity prices repeatedly hit $3,000 a megawatt hour, which is three times the maximum amount that generators can charge in deregulated electricity markets in the eastern United States.11

Competition for water also intensified. More than 16% of electricity production relied on cooling water from sources that shrank to historically low levels,8 and demands for water used to generate electricity competed with simultaneous demands for agriculture and other human activities. City and regional managers rationed water to farms and urban areas, and in some instances, water was trucked to communities that lacked sufficient supplies.9 As late as January 2012, customers of 1,010 Texas water systems were being asked to restrict water use; mandatory water restrictions were in place in 647 water systems.12 At the same time, changing vegetation attributes, grazing, cropping, and wildfire compromised water quality and availability, increasing the amount of power required for water pumping and purification.

solar panels ©Michael DeYoung/Corbis

The Texas example shows how energy, land, water, and weather interacted in one region. Extreme weather events may affect other regions differently, because of the relative vulnerability of energy, water, and land resources, linkages, and infrastructure. For example, sustained droughts in the Northwest will affect how water managers release water from reservoirs, which in turn will affect water deliveries for ecosystem services, irrigation, recreation, and hydropower. Further complicating matters, hydropower is increasingly being used to balance variable wind generation in the Northwest, and seasonal hydroelectric restrictions have already created challenges to fulfilling this role. In the Midwest, drought poses challenges to meeting electricity demands because diminished water availability and elevated water temperatures reduce the efficiency of electricity generation by thermoelectric power plants. To protect water quality, federal and state regulations can require suspension of operations of thermoelectric power plants if water used to cool the power plants exceeds established temperature thresholds as it is returned to streams.

Energy, land, water, and weather interactions are not limited to drought. For instance, 2011 also saw record flooding in the Mississippi basin. Floodwaters surrounded the Fort Calhoun nuclear power plant in Nebraska, shut down substations, and caused a wide range of energy, land, and water impacts (Ch. 3: Water).

Interactions of Energy, Water, and Land Uses

Figure 10.4 depicts the current mix of energy, water, and land use within each U.S. region. The mixes reflect competition for water and land resources, but more importantly for the purposes here, the mixes reflect linkages across the energy, water, and land sectors as well as linkages to climate. For example, higher water withdrawal for thermoelectric power (power plants that use a steam cycle to generate electricity) generally reflects electric generation technology choices (often coal-, gas-, or nuclear-fired generation with open loop cooling) that assume the availability of large quantities of water. Therefore, the choice of energy technology varies based on the available resources in a region. Similarly, land-water linkages are evident in cropland and agricultural water use. The potential growth in renewable energy may strengthen the linkage between energy and land (see “Examples of Energy, Water, and Land Linkages”). Climate change affects each sector directly and indirectly. For instance, climate change affects water supplies, energy demand, and land productivity, all of which can affect sector-wide decisions.

Figure 10.4: Regional Water, Energy, and Land Use, with Projected Climate Change Impacts

Climate Impacts

AlaskaNorthwestSouthwestHawai'iGreat PlainsMidwestNortheastSoutheast
Alaska Northwest Southwest Hawai'i Great Plains Southeast Northeast Midwest
Close

Northeast

Climate Impacts

  • Increased heat waves
  • Storm and sea level induced flooding
  • Fisheries and ecosystems stressed
  • Agriculture shifts
Close

Southeast

Climate Impacts

  • Reduced quality of life
  • Ecosystem impacts
  • Reduced water availability
  • Storm/sea level damage on infrastructure
Close

Midwest

Climate Impacts

  • Exacerbated risk to Great Lakes
  • Altered agricultural practices
  • Increased rainfall and flooding
  • Increased public health risks
Close

Great Plains

Climate Impacts

  • Increased landscape fragmentation
  • Altered farming and ranching practices
  • Increased competition for water resources
  • Vulnerable communities increasingly stressed
Close

Northwest

Climate Impacts

  • Increased coastal vulnerabilities
  • Agricultural shifts
  • Transformed forest landscape
  • Reduced water supply
Close

Southwest

Climate Impacts

  • More public health threats
  • Reduced crop yields
  • Less surface water supply reliability
  • Increased flooding and erosion risk
Close

Alaska

Climate Impacts

  • Native communities at increased risk
  • Growing season lengthens
  • Sea ice and glaciers receding
  • Thawing permafrost damage to infrastructure
Close

Hawai'i

Climate Impacts

  • Storm/sea level damage
  • Coastal and fisheries ecosystem threatened
  • Reduced freshwater availability
  • Increased stress on native plants and animals

Figure 10.4: U.S. regions differ in the manner and intensity with which they use, or have available, energy, water, and land. Water bars represent total water withdrawals in billions of gallons per day (except Alaska and Hawai‘i, which are in millions of gallons per day); energy bars represent energy production for the region in 2012; and land represents land cover by type (green bars) or number of people (white and green bars). Only water withdrawals, not consumption, are shown (see Ch. 3: Water). Agricultural water withdrawals include irrigation, livestock, and aquaculture uses. (Data from EIA 201213 [energy], Kenny et al. 200914 [water], and USDA ERS 200715 [land]).

Details/Download

Key Message 2: Options for Reducing Emissions and Climate Vulnerability

The dependence of energy systems on land and water supplies will influence the development of these systems and options for reducing greenhouse gas emissions, as well as their climate change vulnerability.

Supporting Evidence
close

Supporting Evidence

Process for Developing Key Messages:

The authors met for a one-day face-to-face meeting, and held teleconferences approximately weekly from March through August 2012. They considered a variety of technical input documents, including a Technical Input Report prepared through an interagency process,1 and 59 other reports submitted through the Federal Register Notice request for public input. The key messages were selected based on expert judgment, derived from the set of examples assembled to demonstrate the character and consequences of interactions among the energy, water, and land resource sectors.

Description of evidence base

The key message and supporting text summarizes extensive evidence documented in the Technical Input Report (TIR): Climate and Energy-Water-Land System Interactions: Technical Report to the U.S. Department of Energy in Support of the National Climate Assessment.1 Technical input reports (59) on a wide range of topics were also received and reviewed as part of the Federal Register Notice solicitation for public input.

Synthesis and Assessment Product 2.1 of the Climate Change Science Program,16 which informed the prior National Climate Assessment,17 describes relationships among different future mixtures of energy sources, and associated radiative forcing of climate change, as a context for evaluating emissions mitigation options.

Energy, water, and land linkages represent constraints, risks, and opportunities for private/public planning and investment decisions. There are evolving water and land requirements for four energy technologies: natural gas from shale,13 solar power,18 biofuels,19,20 and carbon dioxide capture and storage (CCS).21 Each of these four technologies could contribute to reducing U.S. emissions of greenhouse gases. These technologies illustrate energy, water, and land linkages and other complexities for the design, planning, and deployment of our energy future.

Evidence for energy production and use are derived from U.S. government reports.22,23 The contributions of hydraulic fracturing to natural gas production are based on a brief article by the Energy Information Administration13 and a primer by the U.S. Department of Energy.24 Information about water and energy demands for utility-scale solar power facilities is derived from two major DOE reports.18,25 Distribution of U.S. solar energy resources is from Web-based products of the National Renewable Energy Laboratory (http://www.nrel.gov/gis/). On biofuels, there are government data on the scale of biomass-based energy,13 and studies on water and land requirements and other social and environmental aspects.19,20

New information and remaining uncertainties

There are no major uncertainties regarding this key message. Progress in development and deployment of the energy technologies described has tended to follow a pattern: potential constraints arise because of dependence on water and land resources, but then these constraints motivate advances in technology to reduced dependence or result in adjustments of societal priorities. There are uncertainties in how energy systems’ dependence on water will be limited by other resources, such as land; uncertainties about the effects on emissions and the development and deployment of future energy technologies; and uncertainties about the impacts of climate change on energy systems.

Assessment of confidence based on evidence

Given the evidence base and remaining uncertainties, confidence is high. The primary limitation on confidence assigned to this key message is with respect to its generality and dependence on technological advances. Energy technology development has the potential to reduce water and land requirements, and to reduce vulnerability to climate change impacts. It is difficult to forecast success in this regard for technologies such as CCS that are still in early phases of development.

Confidence Level

Very High

Strong evidence (established theory, multiple sources, consistent results, well documented and accepted methods, etc.), high consensus

High

Moderate evidence (several sources, some consistency, methods vary and/or documentation limited, etc.), medium consensus

Medium

Suggestive evidence (a few sources, limited consistency, models incomplete, methods emerging, etc.), competing schools of thought

Low

Inconclusive evidence (limited sources, extrapolations, inconsistent findings, poor documentation and/or methods not tested, etc.), disagreement or lack of opinions among experts

Options for Reducing Emissions and Climate Vulnerability

Interactions among energy, water, and land resources have influenced and will continue to influence selection and operation of energy technologies. In some situations, land and water constraints also pose challenges to technology options for reducing greenhouse gas emissions. For example, with the Southwest having most of the potential for deployment of concentrating solar technologies, facilities will need to be extremely water-efficient in order to compete for limited water resources. While wind farms avoid impacts on water resources, issues concerning land use, wildlife impacts, the environment, and aesthetics are often encountered. Raising crops to produce biofuels uses arable land and water that might otherwise be available for food production. This fact came into stark focus during the summer of 2012, when drought caused poor corn harvests, intensifying concerns about allocation of the harvest for food versus ethanol.31

Figure 10.5: Water Use for Electricity Generation by Fuel and Cooling Technology Water Use for Electricity Generation by Fuel and Cooling Technology Details/Download

Competition for water supplies is encouraging deployment of technologies that are less water-intensive than coal or nuclear power with once-through cooling. For example, wind, natural gas, photovoltaic (solar electric), ­and even thermoelectric generation with dry cooling use less water. Challenges in siting land- and water-intensive energy facilities are likely to intensify over time as competition for these resources grows. Considering the interactions among energy, water, and land systems presents opportunities for further identification and implementation of energy options that can reduce emissions, promote resilience, and improve sustainability.

Figure 10.6: Projected Land-use Intensity in 2030 Projected Land-use Intensity in 2030 Details/Download

Every option for reducing greenhouse gas emissions involves tradeoffs that affect natural resources, socioeconomic systems, and the built environment. Energy system technologies vary widely in their carbon emissions and their use of water and land. As such, there are energy-water-land tradeoffs and synergies with respect to adaptation and mitigation. Each choice involves assessing the relative importance of the tradeoffs related to these resources in the context of both short- and long-term risks (see “Examples of Energy, Water, and Land Linkages” that describes four technologies that could play key roles). Figure 10.5 provides a systematic comparison of water withdrawals and consumptive use, illustrating the wide variation across both electric generation technologies and the accompanying cooling technologies. Carbon dioxide capture and storage (CCS) is not included in the chart, but coal-fired power plants (both evaporative cooling and dry cooling) fitted with CCS would consume twice as much water per unit of electricity generated as similar coal-fired facilities without CCS.32 Figure 10.6 shows projected land-use intensity in 2030 for various electricity production methods. Describing land use with a single number is valuable, but must be considered with care. For example, while wind generation can require significant amounts of land, it can co-exist with other activities such as farming and grazing, while other technologies may not be compatible with other land uses. Land and water influences on energy production capacity are expected to get stronger in the future, and greater resource scarcity will shape investment decisions.

cows and windmills ©John Epperson/The Denver Post via Getty Images

Every adaptation and mitigation option involves tradeoffs in how it increases or decreases stress on energy systems and water and land resources. For a selected set of mitigation and adaptation measures, Table 10.1 provides a summary illustrating qualitatively how different technologies relate to energy, water, and land.1

Particularly relevant to climate change mitigation are the energy, water, and land risks associated with low-carbon electricity generation. For example, expansion of nuclear power and coal power with CCS are two measures that have been discussed as a potential part of a future decarbonized energy system.16,33,34 Both are also potentially water intensive and therefore have vulnerabilities related to climate impacts and competing water uses. Alternatively, renewable generation and combined cycle gas and coal have relatively modest water withdrawals (see also EPRI 201135). Overall, energy, water, and land sector vulnerabilities are important factors to weigh in considering alternative electricity generation options and cooling systems.

Bioenergy also presents opportunities for mitigation, but some potential bioenergy feedstocks are land and water intensive. Where land and water resources are limited, bioenergy may therefore be at risk of competing with other uses of land and water, and climate changes present additional challenges. Other mitigation options, such as afforestation (re-establishment of forests), forest management, agricultural soil management, and fertilizer management are also tied intimately into the interfaces among land availability, land management, and water resource quantity and quality.36,37,38

Some sector-specific mitigation and adaptation measures can provide opportunities to enhance climate mitigation or adaptation objectives in the other sectors. However, other measures may have negative impacts on mitigation or adaptation potential in other sectors. If such cross-sector impacts are not considered, they can diminish the effectiveness of climate mitigation and adaptation actions.

For example, switching from coal- to natural-gas-fired electricity generation reduces the emissions associated with power generation. Depending on the situation, the switch to natural gas in the energy sector can either improve or reduce adaptive capacity in the water sector. Natural gas can reduce water use for thermoelectric cooling (gas-fired plants require less cooling water), but natural gas extraction techniques consume water, so water availability must be considered. In addition, gas production has the potential to affect land-based ecosystems by, for example, fragmenting habitat and inhibiting wildlife migration. Future improvements in natural gas technologies and water reuse may reduce the possibility of negative impacts on water supplies and enhance the synergies across the energy, water, and land interface. Incorporating consideration of such cross-sector interactions in planning and policy could affect sectoral decisions and decisions related to climate mitigation and adaptation.

Table 10.1: Energy, water, and land sectoral impacts

close
Mitigation measures Water Land Energy
Switch from coal to natural gas fueled power plants ± ±  
Expand CCS to fossil-fueled power plant - -  
Expansion of nuclear power -    
Expansion of wind + -  
Expansion of solar thermal technologies (wet cooled) - -  
Expansion of commercial scale photovoltaic + -  
Expansion of hydropower ± - +
Expansion of biomass production for energy ± ±  
       
Adaptation measures Water Land Energy
Switch from once-through to recirculating cooling in thermoelectric power plants ±   -
Switch from wet to dry cooling at thermoelectric power plants +   -
Desalinization ± + ±
New storage and conveyance of water ± - -
Switch to drought-tolerant crops in drought vulnerable regions + - +
Increase transmission capacity to urban areas to reduce power outages
during high demand periods
- +  

Table 10.1: Energy, water, and land sectoral impacts associated with a sample of climate mitigation and adaptation measures. "+" = positive effect (reduced stress) on sector, "-" = negative effect (increased stress) on sector. Blank = effect not noted. Blue = consideration of energy extraction and power plant processes. It is important to keep in mind that this table only reflects physical synergies and tradeoffs. There are, of course, economic tradeoffs as well in the form of technology costs and societal concerns, such as energy security, food security, and water quality. Expansion of hybrid or dry-cooled solar technologies, versus wet, could help reduce water risks. For a more detailed description of the entries in the table, see Skaggs et al. 2012.1 Additional considerations regarding energy extraction, power plant processes, and energy use associated with irrigation were added to those reflected in Skaggs et al. 20121 (Adapted from Skaggs et al. 20121).

Changes in the availability of water and land due to climate change and other effects of human activities will affect location, design, choice, and operations of energy technologies in the future and, in some cases, constrain their deployment. Energy, water, and land linkages represent constraints, risks, and opportunities for private/public planning and investment decisions. “Examples of Energy, Water, and Land Linkages” below discusses four energy sector technologies that could contribute to reducing U.S. emissions of greenhouse gases and increasing energy security – natural gas from shale, solar power, biofuels, and CCS. These technologies were chosen to illustrate energy, water, and land linkages and other complexities for the design, planning, and deployment of our energy future.

Examples of Energy, Water, and Land Linkages

Shale Natural Gas and Hydraulic Fracturing

Figure 10.7: Hydraulic Fracturing and Water Use Hydraulic Fracturing and Water Use Details/Download

The U.S. Energy Information Administration projects a 29% increase in U.S. natural gas production by 2035, driven primarily by the economics of shale gas.13 As an energy source, natural gas (methane) can have a major advantage over coal and oil: when combusted, it emits less carbon dioxide per unit energy than other fossil fuels, and fewer pollutants like black carbon (soot) and mercury (see Ch. 27: Mitigation). An increase in natural gas consumption could lead to a reduction in U.S. greenhouse gas emissions compared to continued use of other fossil fuels. Disadvantages include the possibility that low-cost gas could supplant deployment of low-carbon generation technologies, such as nuclear power and renewable energy. In addition, the U.S. Environmental Protection Agency estimates that 6.9 million megatons of methane – with a global warming potential equivalent to 144.7 million megatons of CO2 – is emitted from the U.S. natural gas system through uncontrolled venting and leaks from drilling operations, pipelines, and storage tanks (see Ch. 15: Biogeochemical Cycles; Ch. 27: Mitigation).39 There is considerable uncertainty about these estimates, and it is an active area of research. While technological improvements may reduce this leakage rate,39 leakage makes the comparison between natural gas and coal more complex from a climate perspective.40 For example, methane is a stronger greenhouse gas than carbon dioxide but has a much shorter atmospheric lifetime (see Ch. 15: Biogeochemical Cycles; Ch. 27: Mitigation; Appendix 3: Climate Science; Appendix 4: FAQs).

Recent reductions in natural gas prices are largely due to advances in hydraulic fracturing, which is a drilling method used to retrieve deep reservoirs of natural gas. Hydraulic fracturing injects large quantities of water, sand, and chemicals at high pressure into horizontally-drilled wells as deep as 10,000 feet below the surface in order to break the shale and extract natural gas. 24 Questions about the water quantity necessary and the potential to affect water quality have produced national debate about this method. Federal government and state-led efforts are underway to identify, characterize, and if necessary, find approaches to address these issues (for example, EPA 2011; FracFocus 201241,42).

A typical shale gas well requires from two to four million gallons of water to drill and fracture (equivalent to the annual water use of 20 to 40 people in the U.S, or three to six Olympic-size swimming pools).24 The gas extraction industry has begun reusing water in order to lower this demand. However, with current technology, recycling water can require energy-intensive treatment, and becomes more difficult as salts and other contaminants build up in the water with each reuse.43 In regions where climate change leads to drier conditions, hydraulic fracturing could be vulnerable to climate change related reductions in water supply.

Shale gas development also requires land. To support the drilling and hydraulic fracturing process, a pad, which may be greater than five acres in size, is constructed.44 Land for new roads, compressor stations, pipelines, and water storage ponds are also required.

The competition for water is expected to increase in the future. State and local water managers will need to assess how gas extraction competes with other priorities for water use, including electricity generation, irrigation, municipal supply, industry use, and livestock production. Collectively, such interactions between the energy and water resource sectors increase vulnerability to climate change, particularly in water-limited regions that are projected to, or become, significantly drier.

Solar Power Generation

Figure 10.8: Renewable Energy and Land Use Renewable Energy and Land Use Details/Download

Solar energy technologies have the potential to satisfy a significant portion of U.S. electricity demand and reduce greenhouse gas emissions. The land and water requirements for solar power generation depend on the mix of solar technologies deployed. Small-scale (such as rooftop) installations are integrated into current land use and have minimal water requirements. In contrast, utility-scale solar technologies have significant land requirements and can – depending upon the specific generation and cooling technologies – also require significant water resources. For instance, utility-scale photovoltaic systems can require three to ten acres per megawatt (MW) of generating capacity45 and consume as much as five gallons of water per megawatt hour (MWh) of electricity production. Utility-scale concentrating solar systems can require up to 15 acres per MW46 and consume 1,040 gallons of water per MWh18 using wet cooling (and 97% less water with dry cooling). A recent U.S. Department of Energy study concluded that 14% of the U.S. demand for electricity could be met with solar power by 2030.18 To generate that amount of solar power would require rooftop installations plus about 0.9 million to 2.7 million acres, equivalent to about 1% to 4% of the land area of Arizona, for utility-scale solar power systems and concentrating solar power (CSP).18

Recognizing water limitations, most large-scale solar power systems now in planning or development are designed with dry cooling that relies on molten salt or other materials for heat transfer. However, while dry cooling systems reduce the need for water, they have lower plant thermal efficiencies, and therefore reduced production on hot days.47 Overall, as with other generation technologies, plant designs will have to carefully balance cost, operating issues, and water availability.

Biofuels

Biomass-based energy is currently the largest renewable energy source in the U.S., and biofuels from crops, grass, and trees are the fastest growing renewable domestic bioenergy sector.13 In 2011, approximately 40 million acres of cropland in the U.S. were used for ethanol production, roughly 16% of the land planted for the eight major field crops.48 The long-term environmental and social effects of biofuel production and use depend on many factors: the type of feedstock, management practices used to produce them, fuel production and conversion technologies, prior land use, and land- and water-use changes caused by their production and use.19,20 Biofuels potentially can reduce greenhouse gas emissions by displacing fossil fuel consumption. Biofuels that comply with the Energy Independence and Security Act of 2007 are required to reduce greenhouse gas emissions relative to fossil fuels. In addition, biofuels also have the potential to provide net environmental benefits compared to fossil fuels. For example, ethanol is used as a gasoline additive to meet air quality standards, replacing a previous additive that leaked from storage tanks and contaminated groundwater.49 However, increases in corn production for biofuel has been cited as contributing to harmful algal blooms.19

Currently, most U.S. biofuels, primarily ethanol (from corn) and biodiesel (mainly from soy), are produced from edible parts of crops grown on rain-fed land. Consumptive water use over the life cycle of corn-grain ethanol varies widely, from 15 gallons of water per gallon of gasoline equivalent for rain-fed corn-based ethanol in Ohio, to 1,500 gallons of water per gallon of gasoline equivalent for irrigated corn-based ethanol in New Mexico. In comparison, producing and refining petroleum-based fuels uses 1.9 to 6.6 gallons of water per gallon of gasoline.19,50.

The U.S. Renewable Fuels Standard (RFS) aims to expand production of cellulosic ethanol to at least 16 billion gallons per year by 2022. Cellulosic biofuels, derived from the entire plant rather than just the food portions, potentially have several advantages, such as fewer water quality impacts,51 less water consumption, and the use of forest-derived feedstocks.19 Cellulosic biofuels have not yet been produced in large volumes in the United States. The RFS target could require up to an additional 30 to 60 million acres of land, or alternatively be sourced from other feedstocks, such as forest and agricultural residues and municipal solid waste, but such supplies are projected to be inadequate for meeting the full cellulosic biofuel standard.19

Conversion of land not in cropland to crops for biofuel production may increase water consumption and runoff of fertilizers, herbicides, and sediment.52 The impacts of climate change, particularly in areas where water availability may decrease (see Ch. 2: Our Changing Climate, Ch. 3: Water, and Ch. 6: Agriculture), however, may make it increasingly difficult to raise crops in arid regions of the country. The use of crops that are better suited to arid conditions and are efficient in recycling nutrients, such as switchgrass for cellulosic ethanol, could lower the vulnerability of biofuel production to climate change.53 Another potential source of biomass for biofuel production is microalgae, but the existing technologies are still not carbon neutral, nor commercially viable.54

Carbon Capture and Storage

Carbon capture and storage (CCS) technologies have the potential to capture 90% of CO2 emissions from coal and natural gas combustion by industrial and electric sector facilities and thus allow continued use of low-cost fossil fuels in a carbon-constrained future.55 CCS captures CO2 post- or pre-fuel combustion and injects the CO2 into geologic formations for long-term storage. In addition, combining CCS with bioenergy applications represents one of a few potential options for actually removing CO2 from the atmosphere21 because carbon that was recently in the atmosphere and accumulated by growing plants can be captured and stored.

CCS substantially increases the cost of building and operating a power plant, both through up-front costs and additional energy use during operation (referred to as “parasitic loads” or an energy penalty).55 Substantial amounts of water are also used to separate CO2 from emissions and to generate the required parasitic energy. With current technologies, CCS can increase water consumption 30% to 100%.56 Gasification technologies, where coal or biomass are converted to gases and CO2 is separated before combustion, reduce the energy penalty and water requirements, but currently at higher capital costs.57,58 As with other technologies, technology and design choices for CCS need to be balanced with water requirements and water availability. Climate change will influence the former via effects on energy demand and the latter via precipitation changes. CCS facilities themselves have relatively modest land demands compared to some other generation options. However, bioenergy use with CCS would imply a much stronger land linkage.

CCS facilities for electric power plants are currently operating at pilot scale, and a commercial scale demonstration project is under construction.59,60 Although the potential opportunities are large, many uncertainties remain, including cost, demonstration at scale, environmental impacts, and what constitutes a safe, long-term geologic repository for sequestering carbon dioxide.61

Key Message 3: Challenges to Reducing Vulnerabilities

Jointly considering risks, vulnerabilities, and opportunities associated with energy, water, and land use is challenging, but can improve the identification and evaluation of options for reducing climate change impacts.

Supporting Evidence
close

Supporting Evidence

Process for Developing Key Messages:

The authors met for a one-day face-to-face meeting, and held teleconferences approximately weekly from March through August 2012. They considered a variety of technical input documents, including a Technical Input Report prepared through an interagency process,1 and 59 other reports submitted through the Federal Register Notice request for public input. The key messages were selected based on expert judgment, derived from the set of examples assembled to demonstrate the character and consequences of interactions among the energy, water, and land resource sectors.

Description of evidence base

The key message and supporting text summarizes extensive evidence documented in the Technical Input Report (TIR): Climate and Energy-Water-Land System Interactions: Technical Report to the U.S. Department of Energy in Support of the National Climate Assessment.1 Technical input reports (59) on a wide range of topics were also received and reviewed as part of the Federal Register Notice solicitation for public input.

Interactions among energy, water, and land resource sectors can lead to stakeholder concerns that shape options for reducing vulnerability and thus for adapting to climate change. The Columbia River System provides a good example of an area where risks, vulnerabilities, and opportunities are being jointly considered.62,63 The 2011 Mississippi basin flooding, which shut down substations, provides another example of the interactions of energy, water, and land systems (Ch. 3: Water). For all multi-use river basins, understanding the combined vulnerability of energy, water, and land use to climate change is essential to planning for water management and climate change adaptation.

New information and remaining uncertainties

There are no major uncertainties regarding this key message; however, it is highly uncertain the extent to which local, state and national policies will impact options to reduce vulnerability to climate change.

Assessment of confidence based on evidence

Given the evidence base and remaining uncertainties, confidence is high. The primary limitation on confidence assigned to this key message is with respect to the explicit knowledge of the unique characteristics of each region with regards to impacts of climate change on energy, water, land, and the interactions among these sectors.

Confidence Level

Very High

Strong evidence (established theory, multiple sources, consistent results, well documented and accepted methods, etc.), high consensus

High

Moderate evidence (several sources, some consistency, methods vary and/or documentation limited, etc.), medium consensus

Medium

Suggestive evidence (a few sources, limited consistency, models incomplete, methods emerging, etc.), competing schools of thought

Low

Inconclusive evidence (limited sources, extrapolations, inconsistent findings, poor documentation and/or methods not tested, etc.), disagreement or lack of opinions among experts

Challenges to Reducing Vulnerabilities

The complex nature of interactions among energy, water, and land systems, particularly in the context of climate change, does not lend itself to simple solutions. The energy, water, and land interactions themselves create vulnerabilities to competing resource demands. Climate change is an additional stressor. However, resource management decisions are often focused on just one of these sectors. Where the three sectors are tightly coupled, options for mitigating or adapting to climate change and consideration of the tradeoffs associated with technological or resource availability may be limited. The complex nature of water and energy systems are also highlighted in Chapter 3 (Water), which discusses water constraints in many areas of the U.S., and in Chapter 4 (Energy), where it is noted that there will be challenges across the nation for water quality to comply with thermal regulatory needs for energy production.

A changing climate, particularly in areas projected to be warmer and drier, is expected to lead to drought and stresses on water supply, affecting energy, water, and land sectors in the United States. As the Texas drought of 2011 and 2012 illustrates, impacts to a particular sector, such as energy production, generate consequences for the others, such as water resource availability. Similarly, new energy development and production will require careful consideration of land and water sector resources. As a result, vulnerability to climate change depends on energy, water, and land linkages and on climate risks across all sectors, and decision-making is complex.

Figure 10.9: Water Stress in the U.S. Water Stress in the U.S. Details/Download

The Columbia River Basin is one example of an area where risks, vulnerabilities, and opportunities are being jointly considered by a wide range of stakeholders and decision-makers (see Ch. 28: Adaptation). The Columbia River, which crosses the U.S.-Canada border, is the fourth largest river on the continent by volume, and it drives the production of more electricity than any other river in North America. Approximately 15% of the Columbia River Basin lies within British Columbia (Figure 10.10), but an average of 30% of the total average discharge originates from the Canadian portion of the watershed.64 To provide flood control for the U.S. and predicted releases for hydropower generation, the Columbia River system is managed through a treaty that established a cooperative agreement between the United States and Canada to regulate the river for these two uses.65 The basin also supports a range of other uses, such as navigation, tribal uses, irrigation, fish and wildlife habitat, recreation, and water resources for agricultural, industrial, and individual use. For all multi-use river basins, understanding the combined vulnerability of energy, water, and land use to climate change is essential to planning for water management and climate change adaptation.

Figure 10.10: The Columbia River Basin Land Use and Land Cover The Columbia River Basin Land Use and Land Cover Details/Download

A recent report projects a warmer annual, and drier summer, climate for the Northwest (Ch. 21: Northwest; Ch. 2: Our Changing Climate, Figures 2.14 and 2.15; Appendix 3: Climate Science Supplement, Figures 21 and 22),2 potentially affecting both the timing and amounts of water availability. For example, if climate change reduces streamflow at certain times, fish and wildlife, as well as recreation, may be vulnerable.62 Climate change stressors will also increase the vulnerability of the region’s vast natural ecosystems and forests in multiple ways (see Ch. 7: Forests and Ch. 8: Ecosystems). Currently, only 30% of annual Columbia River Basin runoff can be stored in reservoirs.63 Longer growing seasons might provide opportunities for greater agricultural production, but the projected warmer and drier summers could increase demand for water for irrigation, perhaps at the expense of other water uses due to storage limitations. Wetter winters might offset increased summer demands. However, the storage capacities of many water reservoirs with multiple purposes, including hydropower, were not designed to accommodate significant increases in winter precipitation. Regulations and operational requirements also constrain the ability to accommodate changing precipitation patterns (see Ch. 3: Water).

hydroelectric plant ©James Christensen/Foto Natural/Minded Pictures/Corbis

Because of the complexity of interactions among energy, water, and land systems, considering the complete picture of climate impacts and potential adaptations can help provide better solutions. Adaptation to climate change occurs in large part locally or regionally, and conflicting stakeholder priorities, institutional commitments, and international agreements have the potential to complicate or even compromise adaption strategies with regard to energy, water, and land resources (see also Ch. 28: Adaptation). Effective adaptation to the impacts of climate change requires a better understanding of the interactions among the energy, water, and land resource sectors. Whether managing for water availability and quality in the context of energy systems, or land restrictions, or both, an improved dialog between the scientific and decision-making communities will be necessary to evaluate tradeoffs and compromises needed to manage and understand this complex system. This will require not only integrated and quantitative analyses of the processes that underlie the climate and natural systems, but also an understanding of decision criteria and risk analyses to communicate effectively with stakeholders and decision-makers.

References

  1. Alvarez, R. A., S. W. Pacala, J. J. Winebrake, W. L. Chameides, and S. P. Hamburg, 2012: Greater focus needed on methane leakage from natural gas infrastructure. Proceedings of the National Academy of Sciences, 109, 6435-6440, doi:10.1073/pnas.1202407109. URL | Detail

  2. Averyt, K., J. Fisher, A. Huber-Lee, A. Lewis, J. Macknick, N. Madden, J. Rogers, and S. Tellinghuisen, 2011: Freshwater Use by US Power Plants: Electricity’s Thirst for a Precious Resource. A Report of the Energy and Water in a Warming World initiative. 62 pp., Union of Concerned Scientists. URL | Detail

  3. Bruce, J. P., H. Martin, P. Colucci, G. McBean, J. McDougall, D. Shrubsole, J. Whalley, R. Halliday, M. Alden, L. Mortsch, and B. Mills, 2003: Climate Change Impacts on Boundary and Transboundary Water Management; Report to the Climate Change Impacts Adaptation Program. 161 pp., Natural Resources Canada. URL | Detail

  4. Calvin, K., J. Edmonds, B. Bond-Lamberty, L. Clarke, S. H. Kim, P. Kyle, S. J. Smith, A. Thomson, and M. Wise, 2009: 2.6: Limiting climate change to 450 ppm CO2 equivalent in the 21st century. Energy Economics, 31, S107-S120, doi:10.1016/j.eneco.2009.06.006. | Detail

  5. ,, 2012: Treaty relating to cooperative development of the water resources of the Columbia River Basin (with Annexes). URL | Detail

  6. Clarke, L., J. Edmonds, H. Jacoby, H. Pitcher, J. Reilly, and R. Richels, 2007: Scenarios of Greenhouse Gas Emissions and Atmospheric Concentrations–US Climate Change Science Program Synthesis and Assessment Product 2.1a. Sub-report 2.1A of Synthesis and Assessment Product 2.1. 154 pp., U.S. Department of Energy, Office of Biological & Environmental Research, Washington, D.C. URL | Detail

  7. Costello, C., W. M. Griffin, A. E. Landis, and H. S. Matthews, 2009: Impact of biofuel crop production on the formation of hypoxia in the Gulf of Mexico. Environmental Science & Technology, 43, 7985-7991, doi:10.1021/es9011433. | Detail

  8. Dalton, M., P. Mote, , , , , , and S. Shafer, 2012: A Workshop in Risk-Based Framing of Climate Impacts in the Northwest: Implementing the National Climate Assessment Risk-Based Approach. 77 pp. URL | Detail

  9. Davidson, H. C., and R. K. Paisley, 2009: The Columbia River Basin: Issues & Driving forces within the Columbia River Basin with the potential to affect future transboundary water management. Final report for the Canadian Columbia River Forum. 50 pp., Canadian Columbia River Forum. URL | Detail

  10. Denholm, P., and R. M. Margolis, 2008: Impacts of Array Configuration on Land-Use Requirements for Large-Scale Photovoltaic Deployment in the United States. Conference Paper NREL/CP-670-42971., National Renewable Energy Laboratory, U.S. Department of Energy, Office of Scientific and Technical Information, 7p. URL | Detail

  11. ,, 2008: Estimating Freshwater Needs to Meet Future Thermoelectric Generation Requirements. 2008 Update. DOE/NETL-400/2008/1339. 108 pp., U.S. Department of Energy, National Energy Technology Laboratory. URL | Detail

  12. ,, 2009: Concentrating Solar Power Commercial Application Study: Reducing Water Consumption of Concentrating Solar Power Electricity Generation. Report to Congress. 24 pp., U.S. Department of Energy, Washington, D.C. URL | Detail

  13. ,, 2009: Modern Shale Gas Development in the United States: A Primer. 116 pp., U.S. Department of Energy, Washington, D.C. URL | Detail

  14. ,, 2012: SunShot Vision Study. DOE/GO-102012-3037. 320 pp., U.S. Department of Energy. URL | Detail

  15. Dominguez-Faus, R., S. E. Powers, J. G. Burken, and P. J. Alvarez, 2009: The water footprint of biofuels: A drink or drive Issue? Environmental Science & Technology, 43, 3005-3010, doi:10.1021/es802162x. URL | Detail

  16. ,, 2013: Blue Wing Solar. URL | Detail

  17. ,, 2011: Natural Gas Annual 2010. DOE/EIA-0131(10). U.S. Department of Energy, U.S. Energy Information Administration. URL | Detail

  18. ,, 2012: Annual Energy Outlook 2012 with Projections to 2035. DOE/EIA-0383(2012). 239 pp., U.S. Energy Information Administration, Washington, D.C. URL | Detail

  19. ,, 2013: Methyl Tertiary Butyl Ether: Overview. U.S. Environmental Protection Agency. URL | Detail

  20. ,, 2010: Supplemental EPA Analysis of the American Clean Energy and Security Act of 2009 H.R. 2454 in the 111th Congress. U.S. Environmental Protection Agency. URL | Detail

  21. ,, 2011: Plan to Study the Potential Impacts of Hydraulic Fracturing on Drinking Water Resources. EPA/600/R-11/122. 190 pp., U.S. Environmental Protection Agency, Washington, D.C. URL | Detail

  22. ,, 2013: Inventory of US Greenhouse Gas Emissions and Sinks: 1990-2011. U.S. Environmental Protection Agency, Washington, D.C. URL | Detail

  23. ,, 2013: Cooling Water Intake Structures—CWA 316(b). U.S. Environmental Protection Agency. URL | Detail

  24. ,, 2011: Water Use for Electricity Generation and Other Sectors: Recent Changes (1985-2005) and Future Projections (2005-2030). 2011 Technical Report. 94 pp., Electric Power Research Institute, Palo Alto, CA. URL | Detail

  25. ,, 2011: Grid Operations and Planning Report (Austin, Texas, December 12-13, 2011). 25 pp., Electric Reliability Council of Texas. URL | Detail

  26. Fannin, B., 2011: Texas agricultural drought losses reach record $5.2 billion. AgriLife TODAY. URL | Detail

  27. Fernandez, M., 2012: Texas drought forces a town to sip from a truck. The New York Times. URL | Detail

  28. Fisher, B. S., N. Nakicenovic, K. Alfsen, C. J. Morlot, F. de la Chesnaye, J. - C. Hourcade, K. Jiang, M. Kainuma, E. La Rovere, A. Matysek, A. Rana, K. Riahi, R. Richels, S. Rose, an D. Vuuren, and R. Warren, 2007: Chapter 3: Issues related to mitigation in the long term context. Climate Change 2007: Mitigation. Contribution of Working Group III to the Fourth Assessment Report of the Inter-governmental Panel on Climate Change, B. Metz, Davidson, O.R., Bosch, P.R., Dave, R., and Meyer, L.A., Eds., Cambridge University Press, 169-250. URL | Detail

  29. ,, 2012: FracFocus Chemical Disclosure Registry. Ground Water Protection Council and Interstate Oil and Gas Compact Commission. URL | Detail

  30. Gelsi, S., 2012: Drought revives fuel-versus-food fight. MarketWatch.com. URL | Detail

  31. Giberson, M., 2011: Power Consumption Reaches New Peaks in Texas, ERCOT Narrowly Avoids Rolling Blackouts. The Energy Collective. URL | Detail

  32. Golub, A., T. Hertel, H. - L. Lee, S. Rose, and B. Sohngen, 2009: The opportunity cost of land use and the global potential for greenhouse gas mitigation in agriculture and forestry. Resource and Energy Economics, 31, 299-319, doi:10.1016/j.reseneeco.2009.04.007. | Detail

  33. Graham-Rowe, D., 2011: Agriculture: Beyond food versus fuel. Nature, 474, S6-S8, doi:10.1038/474S06a. URL | Detail

  34. Hoerling, M., M. Chen, R. Dole, J. Eischeid, A. Kumar, J. W. Nielsen-Gammon, P. Pegion, J. Perlwitz, X. - W. Quan, and T. Zhang, 2013: Anatomy of an extreme event. Journal of Climate, 26, 2811–2832, doi:10.1175/JCLI-D-12-00270.1. URL | Detail

  35. ,, 2005: IPCC Special Report on Carbon Dioxide Capture and Storage. Prepared by Working Group III of the Intergovernmental Panel on Climate Change. Intergovernmental Panel on Climate Change, Cambridge University Press, 442 pp. URL | Detail

  36. Karl, T. R., J. T. Melillo, and T. C. Peterson, 2009: Global Climate Change Impacts in the United States. T.R. Karl, Melillo, J.T., and Peterson, T.C., Eds. Cambridge University Press, 189 pp. URL | Detail

  37. Kenny, J. F., N. L. Barber, S. S. Hutson, K. S. Linsey, J. K. Lovelace, and M. A. Maupin, 2009: Estimated Use of Water in the United States in 2005. U.S. Geological Survey Circular 1344. 52 pp., U.S. Geological Survey, Reston, VA. URL | Detail

  38. Kunkel, K. E., L. E. Stevens, S. E. Stevens, L. Sun, E. Janssen, D. Wuebbles, K. T. Redmond, and J. G. Dobson, 2013: Regional Climate Trends and Scenarios for the U.S. National Climate Assessment: Part 6. Climate of the Northwest U.S. NOAA Technical Report NESDIS 142-6. 83 pp., National Oceanic and Atmospheric Administration, National Environmental Satellite, Data, and Information Service, Washington, D.C. URL | Detail

  39. Mai, T., R. Wiser, D. Sandor, G. Brinkman, G. Heath, P. Denholm, D. J. Hostick, N. Darghouth, A. Schlosser, and K. Strzepek, 2012: Renewable Electricity Futures Study. Volume 1: Exploration of High-Penetration Renewable Electricity Futures. NREL/TP-6A20-52409-1. 280 pp., National Renewable Energy Laboratory (NREL), Golden, CO. URL | Detail

  40. McDonald, R. I., J. Fargione, J. Kiesecker, W. M. Miller, and J. Powell, 2009: Energy sprawl or energy efficiency: Climate policy impacts on natural habitat for the United States of America. PLoS ONE, 4, e6802, doi:10.1371/journal.pone.0006802. URL | Detail

  41. Meldrum, J., S. Nettles-Anderson, G. Heath, and J. Macknick, 2013: Life cycle water use for electricity generation: A review and harmonization of literature estimates. Environmental Research Letters, 8, 015031, doi:10.1088/1748-9326/8/1/015031. URL | Detail

  42. ,, 2013: Mississippi Power revises dates, cost of Kemper plant project. URL | Detail

  43. ,, 2012: Climate Data Online. National Climatic Data Center. URL | Detail

  44. ,, 2010: Cost and Performance Baseline for Fossil Energy Plants Volume 1: Bituminous Coal and Natural Gas to Electricity Revision 2, November 2010. DOE/NETL-2010/1397. 626 pp., National Energy Technology Laboratory, U.S. Department of Energy. URL | Detail

  45. ,, 2013: Demonstration of a Coal-Based Transport Gasifier. 2 pp., National Energy Technology Laboratory, U.S. Department of Energy. URL | Detail

  46. ,, 2013: Gasifipedia: Advantages of Gasification – High Efficiency. National Energy Technology Laboratory, U.S. Department of Energy. URL | Detail

  47. Newmark, R. L., S. J. Friedmann, and S. A. Carroll, 2010: Water challenges for geologic carbon capture and sequestration. Environmental Management, 45, 651-661, doi:10.1007/s00267-010-9434-1. URL | Detail

  48. ,, 2011: Renewable Fuel Standard: Potential Economic and Environmental Effects of U.S. Biofuel Policy. 250 pp., National Research Council, The National Academies Press, Washington, D.C. URL | Detail

  49. ,, 2013: Sustainability for the Nation: Resource Connection and Governance Linkages. National Research Council. The National Academies Press, 124 pp. URL | Detail

  50. ,, 2011: Marcellus shale fact sheet. 4 pp., Pennsylvania Department of Environmental Protection. URL | Detail

  51. Peterson, T. C., P. A. Stott, and S. Herring, 2012: Explaining extreme events of 2011 from a climate perspective. Bulletin of the American Meteorological Society, 93, 1041-1067, doi:10.1175/BAMS-D-12-00021.1. URL | Detail

  52. Rose, S. K., and B. Sohngen, 2011: Global forest carbon sequestration and climate policy design. Environment and Development Economics, 16, 429-454, doi:10.1017/S1355770X11000027. | Detail

  53. Scott, S. A., M. P. Davey, J. S. Dennis, I. Horst, C. J. Howe, D. J. Lea-Smith, and A. G. Smith, 2010: Biodiesel from algae: Challenges and prospects. Current Opinion in Biotechnology, 21, 277-286, doi:10.1016/j.copbio.2010.03.005. URL | Detail

  54. Skaggs, R., K. Hibbard, P. Frumhoff, T. Lowry, R. Middleton, R. Pate, V. Tidwell, J. Arnold, K. Avert, A. Janetos, C. Izaurralde, J. Rice, and S. Rose, 2012: Climate and Energy-Water-Land System Interactions. Technical Report to the U.S. Department of Energy in Support of the National Climate Assessment. PNNL-21185. 152 pp., Pacific Northwest National Laboratory, Richland, Washington. URL | Detail

  55. Stark, M., R. Allingham, J. Calder, T. Lennartz-Walker, K. Wai, P. Thompson, and S. Zhao, 2012: Water and Shale Gas Development: Leveraging the US Experience in New Shale Developments. 72 pp., Accenture. URL | Detail

  56. ,, 2011: Dangerous wildfire conditions predicted for Friday. Texas A&M Forest Service. URL | Detail

  57. ,, 2011: Preliminary estimates show hundreds of millions of trees killed by 2011 drought. Texas A&M Forest Service. | Detail

  58. Tsoutsos, T., N. Frantzeskaki, and V. Gekas, 2005: Environmental impacts from the solar energy technologies. Energy Policy, 33, 289-296, doi:10.1016/S0301-4215(03)00241-6. | Detail

  59. Turchi, C., M. Mehos, C. K. Ho, and G. J. Kolb, 2010: Current and Future Costs for Parabolic Trough and Power Tower Systems in the US Market. NREL/CP-5500-49303. SolarPACES 2010, Perpignan, France, National Renewable Energy Laboratory, U.S. Department of Energy, Office of Scientific and Technical Information, 11p. URL | Detail

  60. ,, 2007: Major Land Uses. U.S. Department of Agriculture, Economic Research Service. URL | Detail

  61. ,, 2012: Agricultural Projections to 2021. 96 pp., U.S. Department of Agriculture, Washington, D.C. URL | Detail

  62. ,, 2013: National Assessment of Geologic Carbon Dioxide Storage Resources—Summary: U.S. Geological Survey Fact Sheet 2013–3020. 6 pp., U.S. Geological Survey Geologic Carbon Dioxide Storage Resources Assessment Team, Reston, VA. URL | Detail

  63. Webb, A., and D. Coates, 2012: Biofuels and Biodiversity. CBD Technical Series No. 65. 69 pp., Secretariat of the Convention on Biological Diversity., Montreal. URL | Detail

  64. Wu, M., and Y. Chiu, 2011: Consumptive Water Use in the Production of Ethanol and Petroleum Gasoline – 2011 Update. ANL/ESD/09-1 – Update. 100 pp., Argonne National Laboratory, Energy Systems Division. URL | Detail

  65. Wythe, K., 2013: Community Water Systems Recovering From the Drought: Lessons Learned; Plans Made. Texas Water Resources Institute. URL | Detail

  66. Zhai, H., E. S. Rubin, and P. L. Versteeg, 2011: Water use at pulverized coal power plants with postcombustion carbon capture and storage. Environmental Science & Technology, 45, 2479-2485, doi:10.1021/es1034443. | Detail

The National Climate Assessment summarizes the impacts of climate change on the United States, now and in the future.

A team of more than 300 experts guided by a 60-member Federal Advisory Committee produced the report, which was extensively reviewed by the public and experts, including federal agencies and a panel of the National Academy of Sciences.

United States Global Change Research Program logo United States Global Change Research Program participating agency logos