This website is the digital version of the 2014 National Climate Assessment, produced in collaboration with the U.S. Global Change Research Program.

For the official version, please refer to the PDF in the downloads section. The downloadable PDF is the official version of the 2014 National Climate Assessment.

Credits | Site Map

Search Options

X

Search form

Top

Welcome to the National Climate Assessment

The National Climate Assessment summarizes the impacts of climate change on the United States, now and in the future.

A team of more than 300 experts guided by a 60-member Federal Advisory Committee produced the report, which was extensively reviewed by the public and experts, including federal agencies and a panel of the National Academy of Sciences.

Explore the effects of climate change
United States Global Change Research Program logo
United States Department of Agriculture logo United States Department of Commerce logo United States Department of Defense logo United States Department of Energy logo United States Department of Health and Human Services logo United States Department of the Interior logo United States Department of State logo United States Department of Transportation logo United States Environmental Protection Agency logo National Aeronautics and Space Administration logo National Science Foundation logo Smithsonian Institution logo United States Agency for International Development logo

Southwest

Increased heat, drought, and insect outbreaks, all linked to climate change, have increased wildfires. Declining water supplies, reduced agricultural yields, health impacts in cities due to heat, and flooding and erosion in coastal areas are additional concerns.

Explore how climate change is affecting the Southwest.

Next

Convening Lead Authors

Gregg Garfin, University of Arizona

Guido Franco, California Energy Commission

Lead Authors

Hilda Blanco, University of Southern California

Andrew Comrie, University of Arizona

Patrick Gonzalez, National Park Service

Thomas Piechota, University of Nevada, Las Vegas

Rebecca Smyth, National Oceanic and Atmospheric Administration

Reagan Waskom, Colorado State University

Introduction

The Southwest is the hottest and driest region in the United States, where the availability of water has defined its landscapes, history of human settlement, and modern economy. Climate changes pose challenges for an already parched region that is expected to get hotter and, in its southern half, significantly drier. Increased heat and changes to rain and snowpack will send ripple effects throughout the region’s critical agriculture sector, affecting the lives and economies of 56 million people – a population that is expected to increase 68% by 2050, to 94 million.5 Severe and sustained drought will stress water sources, already over-utilized in many areas, forcing increasing competition among farmers, energy producers, urban dwellers, and plant and animal life for the region’s most precious resource.

Southwest image ©Momatiuk - Eastcott/Corbis

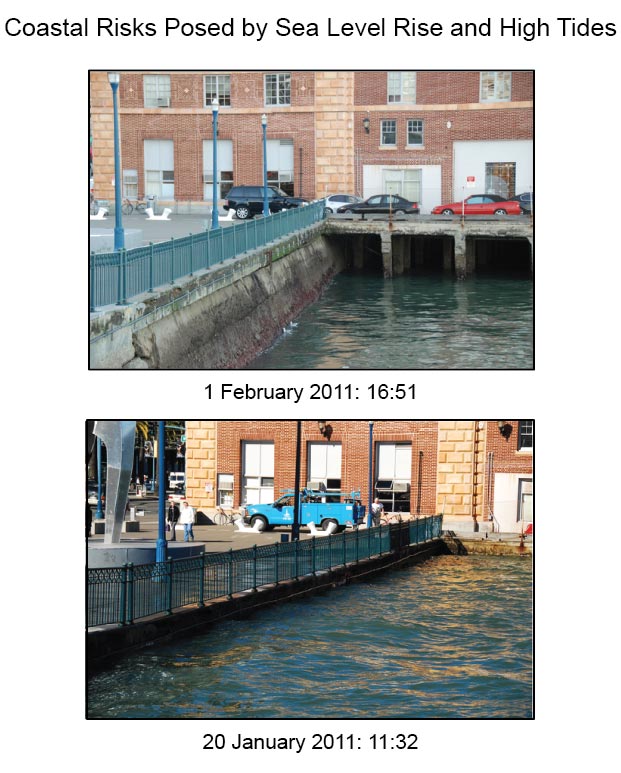
The region’s populous coastal cities face rising sea levels, extreme high tides, and storm surges, which pose particular risks to highways, bridges, power plants, and sewage treatment plants. Climate-related challenges also increase risks to critical port cities, which handle half of the nation’s incoming shipping containers.

Agriculture, a mainstay of the regional and national economies, faces uncertainty and change. The Southwest produces more than half of the nation’s high-value specialty crops, including certain vegetables, fruits, and nuts. The severity of future impacts will depend upon the complex interaction of pests, water supply, reduced chilling periods, and more rapid changes in the seasonal timing of crop development due to projected warming and extreme events.

Climate changes will increase stress on the region’s rich diversity of plant and animal species. Widespread tree death and fires, which already have caused billions of dollars in economic losses, are projected to increase, forcing wholesale changes to forest types, landscapes, and the communities that depend on them (see also Ch. 7: Forests).

Tourism and recreation, generated by the Southwest’s winding canyons, snow-capped peaks, and Pacific Ocean beaches, provide a significant economic force that also faces climate change challenges. The recreational economy will be increasingly affected by reduced streamflow and a shorter snow season, influencing everything from the ski industry to lake and river recreation.

Observed and Projected Climate Change

The Southwest is already experiencing the impacts of climate change. The region has heated up markedly in recent decades, and the period since 1950 has been hotter than any comparably long period in at least 600 years (Ch. 2: Our Changing Climate, Key Message 3).2,3,4,5,6,7,8,9,10 The decade 2001-2010 was the warmest in the 110-year instrumental record, with temperatures almost 2°F higher than historic averages, with fewer cold air outbreaks and more heat waves.5 Compared to relatively uniform regional temperature increases, precipitation trends vary considerably across the region, with portions experiencing decreases and others experiencing increases (Ch. 2: Our Changing Climate, Key Message 5).5 There is mounting evidence that the combination of human-caused temperature increases and recent drought has influenced widespread tree mortality,11,12 increased fire occurrence and area burned,13 and forest insect outbreaks (Ch. 7: Forests).14 Human-caused temperature increases and drought have also caused earlier spring snowmelt and shifted runoff to earlier in the year.15

Regional annual average temperatures are projected to rise by 2.5°F to 5.5°F by 2041-2070 and by 5.5°F to 9.5°F by 2070-2099 with continued growth in global emissions (A2 emissions scenario), with the greatest increases in the summer and fall (Figure 20.1). If global emissions are substantially reduced (as in the B1 emissions scenario), projected temperature increases are 2.5°F to 4.5°F (2041-2070), and 3.5°F to 5.5°F (2070-2099). Summertime heat waves are projected to become longer and hotter, whereas the trend of decreasing wintertime cold air outbreaks is projected to continue (Ch. 2: Our Changing Climate, Key Message 7).16,17 These changes will directly affect urban public health through increased risk of heat stress, and urban infrastructure through increased risk of disruptions to electric power generation.18,19,20,21,22,23,24 Rising temperatures also have direct impacts on crop yields and productivity of key regional crops, such as fruit trees.

Figure 20.1: Projected Temperature Increases Projected Temperature Increases Details/Download

Projections of precipitation changes are less certain than those for temperature.1,25 Under a continuation of current rising emissions trends (A2), reduced winter and spring precipitation is consistently projected for the southern part of the Southwest by 2100 as part of the general global precipitation reduction in subtropical areas. In the northern part of the region, projected winter and spring precipitation changes are smaller than natural variations. Summer and fall changes are also smaller than natural variations throughout the region (Ch. 2: Our Changing Climate, Key Message 5).1 An increase in winter flood hazard risk in rivers is projected due to increases in flows of atmospheric moisture into California’s coastal ranges and the Sierra Nevada (Ch. 3: Water).26,27 These “atmospheric rivers” have contributed to the largest floods in California history28 and can penetrate inland as far as Utah and New Mexico.

The Southwest is prone to drought. Southwest paleoclimate records show severe mega-droughts at least 50 years long.29,30,31 Future droughts are projected to be substantially hotter, and for major river basins such as the Colorado River Basin, drought is projected to become more frequent, intense, and longer lasting than in the historical record.25 These drought conditions present a huge challenge for regional management of water resources and natural hazards such as wildfire. In light of climate change and water resources treaties with Mexico, discussions will need to continue into the future to address demand pressures and vulnerabilities of groundwater and surface water systems that are shared along the border.

Vulnerabilities of Native Nations and Border Cities

The Southwest’s 182 federally recognized tribes and communities in its U.S.-Mexico border region share particularly high vulnerabilities to climate changes such as high temperatures, drought, and severe storms. Tribes may face loss of traditional foods, medicines, and water supplies due to declining snowpack, increasing temperatures, and increasing drought (see also Ch 12: Indigenous Peoples).32,33 Historic land settlements and high rates of poverty – more than double that of the general U.S. population34 – constrain tribes’ abilities to respond effectively to climate challenges.

Most of the Southwest border population is concentrated in eight pairs of fast-growing, adjacent cities on either side of the U.S.-Mexico border (like El Paso and Juárez) with shared problems. If the 24 U.S. counties along the entire border were aggregated as a 51st state, they would rank near the bottom in per capita income, employment rate, insurance coverage for children and adults, and high school completion.35 Lack of financial resources and low tax bases for generating resources have resulted in a lack of roads and safe drinking water infrastructure, which makes it more daunting for tribes and border populations to address climate change issues. These economic pressures increase vulnerabilities to climate-related health and safety risks, such as air pollution, inadequate erosion and flood control, and insufficient safe drinking water.36

Key Message 1: Reduced Snowpack and Streamflows

Snowpack and streamflow amounts are projected to decline in parts of the Southwest, decreasing surface water supply reliability for cities, agriculture, and ecosystems.

Supporting Evidence
close

Supporting Evidence

Process for Developing Key Messages:

A central component of the assessment process was the Southwest Regional Climate assessment workshop that was held August 1-4, 2011, in Denver, CO with more than 80 participants in a series of scoping presentations and workshops. The workshop began the process leading to a foundational Technical Input Report (TIR) report.41 The TIR consists of nearly 800 pages organized into 20 chapters that were assembled by 122 authors representing a wide range of inputs, including governmental agencies, non-governmental organizations, tribes, and other entities. The report findings were described in a town hall meeting at the American Geophysical Union’s annual fall meeting in 2011, and feedback was collected and incorporated into the draft.

The chapter author team engaged in multiple technical discussions through more than 15 biweekly teleconferences that permitted a careful review of the foundational TIR41 and of approximately 125 additional technical inputs provided by the public, as well as the other published literature and professional judgment. The chapter author team then met at the University of Southern California on March 27-28, 2012, for expert deliberation of draft key messages by the authors. Each key message was defended before the entire author team prior to the key message being selected for inclusion. These discussions were supported by targeted consultation with additional experts by the lead author of each message, and they were based on criteria that help define “key vulnerabilities, which include magnitude, timing, persistence and reversibility, likelihood and confidence, potential for adaptation, distribution, and importance of the vulnerable system.”42

Over the past 50 years, there has been a reduction in the amount of snow measured on April 1 as a proportion of the precipitation falling in the corresponding water-year (October to September), which affects the timing of snowfed rivers. The implication of this finding is that the lower the proportion of April 1 snow water equivalent in the water-year-to-date precipitation, the more rapid the runoff, and the earlier the timing of center-of-mass of streamflow in snowfed rivers.43,44 For the “recent decade” (2001 to 2010), snowpack evidence is from U.S. Department of Agriculture (USDA) Natural Resources Conservation Service snow course data, updated through 2010. One study5 has analyzed streamflow amounts for the region’s four major river basins, the Colorado, Sacramento-San Joaquin, Great Basin (Humboldt River, NV), and the Rio Grande; data are from the U.S. Department of the Interior – Bureau of Reclamation, California Department of Water Resources, U.S. Geological Survey, and the International Boundary and Water Commission (U.S. Section), respectively. These data are backed by a rigorous detection and attribution study.15 Projected trends25 make use of downscaled climate parameters for 16 global climate models (GCMs), and hydrologic projections for the Colorado River, Rio Grande, and Sacramento-San Joaquin River System.

Based on GCM projections, downscaled and run through the variable infiltration capacity (VIC) hydrological model,45 there are projected reductions in spring snow accumulation and total annual runoff, leading to reduced surface water supply reliability for much of the Southwest, with greater impacts occurring during the second half of this century.25,46,47

Future flows in the four major Southwest rivers are projected to decline as a result of a combination of increased temperatures, increased evaporation, less snow, and less persistent snowpack. These changes have been projected to result in decreased surface water supplies, which will have impacts for allocation of water resources to major uses, such as urban drinking water, agriculture, and ecosystem flows.

New information and remaining uncertainties

Different model simulations predict different levels of snow loss. These differences arise because of uncertainty in climate change warming and precipitation projections due to differences among GCMs, uncertainty in regional downscaling, uncertainty in hydrological modeling, differences in emissions, aerosols, and other forcings, and because differences in the hemispheric and regional-scale atmospheric circulation patterns produced by different GCMs produce different levels of snow loss in different model simulations.

In addition to the aforementioned uncertainties in regional climate and hydrology projections, projection of future surface water supply reliability includes at least the following additional uncertainties: 1) changes in water management, which depend on agency resources and leadership and cooperation of review boards and the public;37 2) management responses to non-stationarity;38 3) legal, economic, and institutional options for augmenting existing water supplies, adding underground water storage and recovery infrastructure, and fostering further water conservation (for example, Udall 201339); 4) adjudication of unresolved water rights; and 5) local, state, regional, and national policies related to the balance of agricultural, ecosystem, and urban water use (for example,40).

Assessment of confidence based on evidence

There is high confidence in the continued trend of declining snowpack and streamflow in parts of the Southwest given the evidence base and remaining uncertainties.

For the impacts on water supply, there is high confidence that reduced surface water supply reliability will affect the region’s cities, agriculture, and ecosystems.

Confidence Level

Very High

Strong evidence (established theory, multiple sources, consistent results, well documented and accepted methods, etc.), high consensus

High

Moderate evidence (several sources, some consistency, methods vary and/or documentation limited, etc.), medium consensus

Medium

Suggestive evidence (a few sources, limited consistency, models incomplete, methods emerging, etc.), competing schools of thought

Low

Inconclusive evidence (limited sources, extrapolations, inconsistent findings, poor documentation and/or methods not tested, etc.), disagreement or lack of opinions among experts

Reduced Snowpack and Streamflows

Figure 20.2: Projected Snow Water Equivalent Projected Snow Water Equivalent Details/Download

Winter snowpack, which slowly melts and releases water in spring and summer, when both natural ecosystems and people have the greatest needs for water, is key to the Southwest’s hydrology and water supplies. Over the past 50 years across most of the Southwest, there has been less late-winter precipitation falling as snow, earlier snowmelt, and earlier arrival of most of the year’s streamflow.43,44 Streamflow totals in the Sacramento-San Joaquin, the Colorado, the Rio Grande, and in the Great Basin were 5% to 37% lower between 2001 and 2010 than the 20th century average flows.5 Projections of further reduction of late-winter and spring snowpack and subsequent reductions in runoff and soil moisture46,47,50 pose increased risks to the water supplies needed to maintain the Southwest’s cities, agriculture, and ecosystems.

Draught near Hite Marina ©Peter Essick/Getty Images

Temperature-driven reductions in snowpack are compounded by dust and soot accumulation on the surface of snowpack. This layer of dust and soot, transported by winds from lowland regions, increases the amount of the sun’s energy absorbed by the snow. This leads to earlier snowmelt and evaporation – both of which have negative implications for water supply, alpine vegetation, and forests.51,52,53,54 The prospect of more lowland soil drying out from drought and human disturbances (like agriculture and development) makes regional dust a potent future risk to snow and water supplies.

In California, drinking water infrastructure needs are estimated at $4.6 billion annually over the next 10 years, even without considering the effects of climate change.55 Climate change will increase the cost of maintaining and improving drinking water infrastructure, because expanded wastewater treatment and desalinating water for drinking are among the key strategies for supplementing water supplies.

The Southwest’s Renewable Potential to Produce Energy with Less Water

The Southwest’s abundant geothermal, wind, and solar power-generation resources could help transform the region’s electric generating system into one that uses substantially more renewable energy. This transformation has already started, driven in part by renewable energy portfolio standards adopted by five of six Southwest states, and renewable energy goals in Utah. California’s law limits imports of baseload electricity generation from coal and oil and mandates reduction of heat-trapping greenhouse gas emissions to 1990 levels by 2020.56

As the regional climate becomes hotter and, in parts of the Southwest, drier, there will be less water available for the cooling of thermal power plants (Ch. 2: Our Changing Climate),57,58,59 which use about 40% of the surface water withdrawn in the United States.60 The projected warming of water in rivers and lakes will reduce the capacity of thermal power plants, especially during summer when electricity demand skyrockets.61 Wind and solar photovoltaic installations could substantially reduce water withdrawals. A large increase in the portion of power generated by renewable energy sources may be feasible at reasonable costs,62,63,48 and could substantially reduce water withdrawals (Ch. 10: Energy, Water, and Land).64

Figure 20.3: Scenario for Greenhouse Gas Emissions Reductions in the Electricity Sector Scenario for Greenhouse Gas Emissions Reductions in the Electricity Sector Details/Download

Conservation efforts have proven to reduce water use, but are not projected to be sufficient if current trends for water supply and demand continue.65 Large water utilities are currently attempting to understand how water supply and demand may change in conjunction with climate changes, and which adaptation options are most viable.66,40,67

Key Message 2: Threats to Agriculture

The Southwest produces more than half of the nation’s high-value specialty crops, which are irrigation-dependent and particularly vulnerable to extremes of moisture, cold, and heat. Reduced yields from increasing temperatures and increasing competition for scarce water supplies will displace jobs in some rural communities.

Supporting Evidence
close

Supporting Evidence

Process for Developing Key Messages:

A central component of the assessment process was the Southwest Regional Climate assessment workshop that was held August 1-4, 2011, in Denver, CO with more than 80 participants in a series of scoping presentations and workshops. The workshop began the process leading to a foundational Technical Input Report (TIR) report.41 The TIR consists of nearly 800 pages organized into 20 chapters that were assembled by 122 authors representing a wide range of inputs, including governmental agencies, non-governmental organizations, tribes, and other entities. The report findings were described in a town hall meeting at the American Geophysical Union’s annual fall meeting in 2011, and feedback was collected and incorporated into the draft.

The chapter author team engaged in multiple technical discussions through more than 15 biweekly teleconferences that permitted a careful review of the foundational TIR41 and of approximately 125 additional technical inputs provided by the public, as well as the other published literature and professional judgment. The chapter author team then met at the University of Southern California on March 27-28, 2012, for expert deliberation of draft key messages by the authors. Each key message was defended before the entire author team prior to the key message being selected for inclusion. These discussions were supported by targeted consultation with additional experts by the lead author of each message, and they were based on criteria that help define “key vulnerabilities, which include magnitude, timing, persistence and reversibility, likelihood and confidence, potential for adaptation, distribution, and importance of the vulnerable system.”42

Over the past 50 years, there has been a reduction in the amount of snow measured on April 1 as a proportion of the precipitation falling in the corresponding water-year (October to September), which affects the timing of snowfed rivers. The implication of this finding is that the lower the proportion of April 1 snow water equivalent in the water-year-to-date precipitation, the more rapid the runoff, and the earlier the timing of center-of-mass of streamflow in snowfed rivers.43,44 For the “recent decade” (2001 to 2010), snowpack evidence is from U.S. Department of Agriculture (USDA) Natural Resources Conservation Service snow course data, updated through 2010. One study5 has analyzed streamflow amounts for the region’s four major river basins, the Colorado, Sacramento-San Joaquin, Great Basin (Humboldt River, NV), and the Rio Grande; data are from the U.S. Department of the Interior – Bureau of Reclamation, California Department of Water Resources, U.S. Geological Survey, and the International Boundary and Water Commission (U.S. Section), respectively. These data are backed by a rigorous detection and attribution study.15 Projected trends25 make use of downscaled climate parameters for 16 global climate models (GCMs), and hydrologic projections for the Colorado River, Rio Grande, and Sacramento-San Joaquin River System.

Based on GCM projections, downscaled and run through the variable infiltration capacity (VIC) hydrological model,45 there are projected reductions in spring snow accumulation and total annual runoff, leading to reduced surface water supply reliability for much of the Southwest, with greater impacts occurring during the second half of this century.25,46,47

Future flows in the four major Southwest rivers are projected to decline as a result of a combination of increased temperatures, increased evaporation, less snow, and less persistent snowpack. These changes have been projected to result in decreased surface water supplies, which will have impacts for allocation of water resources to major uses, such as urban drinking water, agriculture, and ecosystem flows.

Description of evidence base

Increased competition for scarce water was presented in the first key message and in the foundational Technical Input Report (TIR).41 U.S. temperatures, including those for the Southwest region, have increased and are expected to continue to rise (Ch. 2: Our Changing Climate, Key Message 3). Heat waves have become more frequent and intense and droughts are expected to become more intense in the Southwest (Ch. 2: Our Changing Climate, Key Message 7). The length of the frost-free season in the Southwest has been increasing, and frost-free season length is projected to increase (Ch. 2: Our Changing Climate, Key Message 4). A regional study1 discusses the trends and scenarios in the Southwest for moisture, cold, heat, and their extremes.

There is abundant evidence of irrigation dependence and vulnerability of high-value specialty crops to extremes of moisture, cold, and heat, including, prominently, the 2009 National Climate Assessment68 and the foundational TIR.41 Southwest agricultural production statistics and irrigation dependence of that production is delineated in the USDA 2007 Census of Agriculture69 and the USDA Farm and Ranch Irrigation Survey.70

Reduced Yields. Even under the most conservative emissions scenarios evaluated (the combination of SRES B1emissions scenario with statistically downscaled winter chill projections from the HADCM3 climate model), one study71 projected that required winter chill periods will fall below the number of hours that are necessary for many of the nut- and fruit-bearing trees of California, and yields are projected to decline as a result. A second study72 found that California wheat acreage and walnut acreage will decline due to increased temperatures. Drought and extreme weather may have more effect on the market value of fruits and vegetables, as opposed to other crops, because fruits and vegetables have high water content and because consumers expect good visual appearance and flavor.73 Extreme daytime and nighttime temperatures have been shown to accelerate crop ripening and maturity, reduce yield of crops such as corn, fruit trees, and vineyards, cause livestock to be stressed, and increase water consumption in agriculture.74

Irrigation water transfers to urban. Warmer, drier future scenarios portend large transfers of irrigation water to urban areas even though agriculture will need additional water to meet crop demands, affecting local agriculturally-dependent economies.75 In particular areas of the Southwest (most notably lower-central Arizona), a significant reduction in irrigated agriculture is already underway as land conversion occurs near urban centers.76 Functioning water markets, which may require legal and institutional changes, can enable such transfers and reduce the social and economic impacts of water shortages to urban areas.77 The economic impacts of climate change on Southwest fruit and nut growers are projected to be substantial and will result in a northward shift in production of these crops, displacing growers and affecting communities.

New information and remaining uncertainties

Competition for water is an uncertainty. The extent to which water transfers take place depends on whether complementary investments in conveyance or storage infrastructure are made. Currently, there are legal and institutional restrictions limiting water transfers across state and local jurisdictions. It is uncertain whether infrastructure investments will be made or whether institutional innovations facilitating transfers will develop. Institutional barriers will be greater if negative third-party effects of transfers are not adequately addressed. Research that would improve the information base to inform future water transfer debates includes: 1) estimates of third party impacts, 2) assessment of institutional mechanisms to reduce those impacts, 3) environmental impacts of water infrastructure projects, and 4) options and costs of mitigating those environmental impacts.

Extremes and phenology. A key uncertainty is the timing of extreme events during the phenological stage of the plant or the growth cycle of the animal. For example, plants are more sensitive to extreme high temperatures and drought during the pollination stage compared to vegetative growth stages.

Genetic improvement potential. Crop and livestock reduction studies by necessity depend on assumptions about adaptive actions by farmers and ranchers. However, agriculture has proven to be highly adaptive in the past. A particularly high uncertainty is the ability of conventional breeding and biotechnology to keep pace with the crop plant and animal genetic improvements needed for adaptation to climate-induced biotic and abiotic stresses.

Assessment of confidence based on evidence

Although evidence includes studies of observed climate and weather impacts on agriculture, projections of future changes using climate and crop yield models and econometric models show varying results depending on the choice of crop and assumptions regarding water availability. For example, projections of 2050 California crop yields show reductions in field crop yields, based on assumptions of a 21% decline in agricultural water use, shifts away from water-intensive crops to high-value specialty crops, and development of a more economical means of transferring water from northern to southern California.77 Other studies, using projections of a dry, warmer future for California, and an assumption that water will flow from lower- to higher-valued uses (such as urban water use), generated a 15% decrease in irrigated acreage and a shift from lower- to higher-valued crops.78

Because net reductions in the costs of water shortages depend on multiple institutional responses, it is difficult as yet to locate a best estimate of water transfers between zero and the upper bound. Water scarcity may also be a function of tradeoffs between economic returns from agricultural production and returns for selling off property or selling water to urban areas (for example, Imperial Valley transfers to San Diego).

Given the evidence base and remaining uncertainties, confidence is high in this key message.

Confidence Level

Very High

Strong evidence (established theory, multiple sources, consistent results, well documented and accepted methods, etc.), high consensus

High

Moderate evidence (several sources, some consistency, methods vary and/or documentation limited, etc.), medium consensus

Medium

Suggestive evidence (a few sources, limited consistency, models incomplete, methods emerging, etc.), competing schools of thought

Low

Inconclusive evidence (limited sources, extrapolations, inconsistent findings, poor documentation and/or methods not tested, etc.), disagreement or lack of opinions among experts

Threats to Agriculture

Farmers are renowned for adapting to yearly changes in the weather, but climate change in the Southwest could happen faster and more extensively than farmers’ ability to adapt. The region’s pastures are rain-fed (non-irrigated) and highly susceptible to projected drought. Excluding Colorado, more than 92% of the region’s cropland is irrigated, and agricultural uses account for 79% of all water withdrawals in the region.79,69,70 A warmer, drier climate is projected to accelerate current trends of large transfers of irrigation water to urban areas,77,76,78 which would affect local agriculturally dependent economies.

California produces about 95% of U.S. apricots, almonds, artichokes, figs, kiwis, raisins, olives, cling peaches, dried plums, persimmons, pistachios, olives, and walnuts, in addition to other high-value crops.80 Drought and extreme weather affect the market value of fruits and vegetables more than other crops because they have high water content and because sales depend on good visual appearance.73 The combination of a longer frost-free season, less frequent cold air outbreaks, and more frequent heat waves accelerates crop ripening and maturity, reduces yields of corn, tree fruit, and wine grapes, stresses livestock, and increases agricultural water consumption.81,74,82,83 This combination of climate changes is projected to continue and intensify, possibly requiring a northward shift in crop production, displacing existing growers and affecting farming communities.72,75

Figure 20.4: Longer Frost-Free Season Increases Stress on Crops Longer Frost-Free Season Increases Stress on Crops Details/Download

Winter chill periods are projected to fall below the duration necessary for many California trees to bear nuts and fruits, which will result in lower yields.71 Warm-season vegetable crops grown in Yolo County, one of California’s biggest producers, may not be viable under hotter climate conditions.72,84 Once temperatures increase beyond optimum growing thresholds, further increases in temperature, like those projected for the decades beyond 2050, can cause large decreases in crop yields and hurt the region’s agricultural economy.

Key Message 3: Increased Wildfire

Increased warming, drought, and insect outbreaks, all caused by or linked to climate change, have increased wildfires and impacts to people and ecosystems in the Southwest. Fire models project more wildfire and increased risks to communities across extensive areas.

Supporting Evidence
close

Supporting Evidence

Process for Developing Key Messages:

A central component of the assessment process was the Southwest Regional Climate assessment workshop that was held August 1-4, 2011, in Denver, CO with more than 80 participants in a series of scoping presentations and workshops. The workshop began the process leading to a foundational Technical Input Report (TIR) report.41 The TIR consists of nearly 800 pages organized into 20 chapters that were assembled by 122 authors representing a wide range of inputs, including governmental agencies, non-governmental organizations, tribes, and other entities. The report findings were described in a town hall meeting at the American Geophysical Union’s annual fall meeting in 2011, and feedback was collected and incorporated into the draft.

The chapter author team engaged in multiple technical discussions through more than 15 biweekly teleconferences that permitted a careful review of the foundational TIR41 and of approximately 125 additional technical inputs provided by the public, as well as the other published literature and professional judgment. The chapter author team then met at the University of Southern California on March 27-28, 2012, for expert deliberation of draft key messages by the authors. Each key message was defended before the entire author team prior to the key message being selected for inclusion. These discussions were supported by targeted consultation with additional experts by the lead author of each message, and they were based on criteria that help define “key vulnerabilities, which include magnitude, timing, persistence and reversibility, likelihood and confidence, potential for adaptation, distribution, and importance of the vulnerable system.”42

Over the past 50 years, there has been a reduction in the amount of snow measured on April 1 as a proportion of the precipitation falling in the corresponding water-year (October to September), which affects the timing of snowfed rivers. The implication of this finding is that the lower the proportion of April 1 snow water equivalent in the water-year-to-date precipitation, the more rapid the runoff, and the earlier the timing of center-of-mass of streamflow in snowfed rivers.43,44 For the “recent decade” (2001 to 2010), snowpack evidence is from U.S. Department of Agriculture (USDA) Natural Resources Conservation Service snow course data, updated through 2010. One study5 has analyzed streamflow amounts for the region’s four major river basins, the Colorado, Sacramento-San Joaquin, Great Basin (Humboldt River, NV), and the Rio Grande; data are from the U.S. Department of the Interior – Bureau of Reclamation, California Department of Water Resources, U.S. Geological Survey, and the International Boundary and Water Commission (U.S. Section), respectively. These data are backed by a rigorous detection and attribution study.15 Projected trends25 make use of downscaled climate parameters for 16 global climate models (GCMs), and hydrologic projections for the Colorado River, Rio Grande, and Sacramento-San Joaquin River System.

Based on GCM projections, downscaled and run through the variable infiltration capacity (VIC) hydrological model,45 there are projected reductions in spring snow accumulation and total annual runoff, leading to reduced surface water supply reliability for much of the Southwest, with greater impacts occurring during the second half of this century.25,46,47

Future flows in the four major Southwest rivers are projected to decline as a result of a combination of increased temperatures, increased evaporation, less snow, and less persistent snowpack. These changes have been projected to result in decreased surface water supplies, which will have impacts for allocation of water resources to major uses, such as urban drinking water, agriculture, and ecosystem flows.

Description of evidence base

Increased warming and drought are extensively described in the foundational Technical Input Report (TIR).41 U.S. temperatures have increased and are expected to continue to rise (Ch. 2: Our Changing Climate, Key Message 3). There have been regional changes in droughts, and there are observed and projected changes in cold and heat waves and droughts (Ch. 2: Our Changing Climate, Key Message 7) for the nation. A study for the Southwest1 discusses trends and scenarios in both cold waves and heat waves.

Analyses of weather station data from the Southwest have detected changes from 1950 to 2005 that favor wildfire, and statistical analyses have attributed the changes to anthropogenic climate change. The changes include increased temperatures,3 reduced snowpack,44 earlier spring warmth,51 and streamflow.15 These climate changes have increased background tree mortality rates from 1955 to 2007 in old-growth conifer forests in California, Colorado, Utah, and the northwestern states12 and caused extensive piñon pine mortality in Arizona, Colorado, New Mexico, and Utah between 1989 and 2003.85

Climate factors contributed to increases in wildfire in the previous century. In mid-elevation conifer forests of the western United States, increases in spring and summer temperatures, earlier snowmelt, and longer summers increased fire frequency by 400% and burned area by 650% from 1970 to 2003.13 Multivariate analysis of wildfire across the western U.S. from 1916 to 2003 indicates that climate was the dominant factor controlling burned area, even during periods of human fire suppression.86 Reconstruction of fires of the past 400 to 3000 years in the western U.S.87,88 and in Yosemite and Sequoia National Parks in California89,90,91 confirm that temperature and drought are the dominant factors explaining fire occurrence.

Four different fire models project increases in fire frequency across extensive areas of the Southwest in this century.92,93,94,95 Multivariate statistical generalized additive models96,93 project extensive increases across the Southwest, but the models project decreases when assuming that climate alters patterns of net primary productivity. Logistic regressions95 project increases across most of California, except for some southern parts of the state, with average fire frequency increasing 37% to 74%. Linear regression models project up to a doubling of burned area in the southern Rockies by 2070 under emissions scenarios B1 or A2.94 The MC1 dynamic global vegetation model projects increases in fire frequencies on 40% of the area of the Southwest from 2000 to 2100 and decreases on 50% of the areas for emissions scenarios B1 and A2.92

Excessive wildfire destroys homes, exposes slopes to erosion and landslides, and threatens public health, causing economic damage.97,98,99,100 Further impacts to communities and various economies (local, state, and national) have been projected.95

New information and remaining uncertainties

Uncertainties in future projections derive from the inability of models to accurately simulate all past fire patterns, and from the different GCMs, emissions scenarios, and spatial resolutions used by different fire model projections. Fire projections depend highly on the spatial and temporal distributions of precipitation projections, which vary widely across GCMs. Although models generally project future increases in wildfire, uncertainty remains on the exact locations. Research groups continue to refine the fire models.

Assessment of confidence based on evidence

There is high confidence in this key message given the extensive evidence base and discussed uncertainties.

Confidence Level

Very High

Strong evidence (established theory, multiple sources, consistent results, well documented and accepted methods, etc.), high consensus

High

Moderate evidence (several sources, some consistency, methods vary and/or documentation limited, etc.), medium consensus

Medium

Suggestive evidence (a few sources, limited consistency, models incomplete, methods emerging, etc.), competing schools of thought

Low

Inconclusive evidence (limited sources, extrapolations, inconsistent findings, poor documentation and/or methods not tested, etc.), disagreement or lack of opinions among experts

Increased Wildfire

Fire naturally shapes southwestern landscapes. Indeed, many Southwest ecosystems depend on periodic wildfire to maintain healthy tree densities, enable seeds to germinate, and reduce pests.101,102 Excessive wildfire destroys homes, exposes slopes to erosion and landslides, threatens public health, and causes economic damage.97,98,99,100 The $1.2 billion in damages from the 2003 Grand Prix fire in southern California illustrates the high cost of wildfires.100

firefighter ©AP Photo/The Press-Enterprise, Terry Pierson

Beginning in the 1910s, the Federal Government developed a national policy of attempting to extinguish every fire, which allowed wood and other fuels to over-accumulate103 and urban development to encroach on fire-prone areas. These changes have also contributed to increasing fire risk.

Increased warming due to climate change,3 drought, insect infestations,104 and accumulation of woody fuels and non-native grasses105,96 make the Southwest vulnerable to increased wildfire. Climate outweighed other factors in determining burned area in the western U.S. from 1916 to 2003,86 a finding confirmed by 3000-year long reconstructions of southwestern fire history.87,89,90,91,88 Between 1970 and 2003, warmer and drier conditions increased burned area in western U.S. mid-elevation conifer forests by 650% (Ch. 7: Forests, Key Message 1).13

Drought and increased temperatures due to climate change have caused extensive tree death across the Southwest.12,85 In addition, winter warming due to climate change has exacerbated bark beetle outbreaks by allowing more beetles, which normally die in cold weather, to survive and reproduce.106 Wildfire and bark beetles killed trees across 20% of Arizona and New Mexico forests from 1984 to 2008.104

Numerous fire models project more wildfire as climate change continues.96,92,93,94,95 Models project a doubling of burned area in the southern Rockies,94 and up to a 74% increase in burned area in California,95 with northern California potentially experiencing a doubling under a high emissions scenario toward the end of the century. Fire contributes to upslope shifting of vegetation, spread of invasive plants after extensive and intense fire, and conversion of forests to woodland or grassland.105,107,108 Historical and projected climate change makes two-fifths (40%) of the region vulnerable to these shifts of major vegetation types or biomes; notably threatened are the conifer forests of southern California and sky islands of Arizona.92

Prescribed burning, mechanical thinning, and retention of large trees can help some southwestern forest ecosystems adapt to climate change.90,109 These adaptation measures also reduce emissions of the gases that cause climate change because long-term storage of carbon in large trees can outweigh short-term emissions from prescribed burning.103,110

Key Message 4: Sea Level Rise and Coastal Damage

Flooding and erosion in coastal areas are already occurring even at existing sea levels and damaging some California coastal areas during storms and extreme high tides. Sea level rise is projected to increase as Earth continues to warm, resulting in major damage as wind-driven waves ride upon higher seas and reach farther inland.

Supporting Evidence
close

Supporting Evidence

Process for Developing Key Messages:

A central component of the assessment process was the Southwest Regional Climate assessment workshop that was held August 1-4, 2011, in Denver, CO with more than 80 participants in a series of scoping presentations and workshops. The workshop began the process leading to a foundational Technical Input Report (TIR) report.41 The TIR consists of nearly 800 pages organized into 20 chapters that were assembled by 122 authors representing a wide range of inputs, including governmental agencies, non-governmental organizations, tribes, and other entities. The report findings were described in a town hall meeting at the American Geophysical Union’s annual fall meeting in 2011, and feedback was collected and incorporated into the draft.

The chapter author team engaged in multiple technical discussions through more than 15 biweekly teleconferences that permitted a careful review of the foundational TIR41 and of approximately 125 additional technical inputs provided by the public, as well as the other published literature and professional judgment. The chapter author team then met at the University of Southern California on March 27-28, 2012, for expert deliberation of draft key messages by the authors. Each key message was defended before the entire author team prior to the key message being selected for inclusion. These discussions were supported by targeted consultation with additional experts by the lead author of each message, and they were based on criteria that help define “key vulnerabilities, which include magnitude, timing, persistence and reversibility, likelihood and confidence, potential for adaptation, distribution, and importance of the vulnerable system.”42

Over the past 50 years, there has been a reduction in the amount of snow measured on April 1 as a proportion of the precipitation falling in the corresponding water-year (October to September), which affects the timing of snowfed rivers. The implication of this finding is that the lower the proportion of April 1 snow water equivalent in the water-year-to-date precipitation, the more rapid the runoff, and the earlier the timing of center-of-mass of streamflow in snowfed rivers.43,44 For the “recent decade” (2001 to 2010), snowpack evidence is from U.S. Department of Agriculture (USDA) Natural Resources Conservation Service snow course data, updated through 2010. One study5 has analyzed streamflow amounts for the region’s four major river basins, the Colorado, Sacramento-San Joaquin, Great Basin (Humboldt River, NV), and the Rio Grande; data are from the U.S. Department of the Interior – Bureau of Reclamation, California Department of Water Resources, U.S. Geological Survey, and the International Boundary and Water Commission (U.S. Section), respectively. These data are backed by a rigorous detection and attribution study.15 Projected trends25 make use of downscaled climate parameters for 16 global climate models (GCMs), and hydrologic projections for the Colorado River, Rio Grande, and Sacramento-San Joaquin River System.

Based on GCM projections, downscaled and run through the variable infiltration capacity (VIC) hydrological model,45 there are projected reductions in spring snow accumulation and total annual runoff, leading to reduced surface water supply reliability for much of the Southwest, with greater impacts occurring during the second half of this century.25,46,47

Future flows in the four major Southwest rivers are projected to decline as a result of a combination of increased temperatures, increased evaporation, less snow, and less persistent snowpack. These changes have been projected to result in decreased surface water supplies, which will have impacts for allocation of water resources to major uses, such as urban drinking water, agriculture, and ecosystem flows.

Description of evidence base

Increased warming and drought are extensively described in the foundational Technical Input Report (TIR).41 U.S. temperatures have increased and are expected to continue to rise (Ch. 2: Our Changing Climate, Key Message 3). There have been regional changes in droughts, and there are observed and projected changes in cold and heat waves and droughts (Ch. 2: Our Changing Climate, Key Message 7) for the nation. A study for the Southwest1 discusses trends and scenarios in both cold waves and heat waves.

Analyses of weather station data from the Southwest have detected changes from 1950 to 2005 that favor wildfire, and statistical analyses have attributed the changes to anthropogenic climate change. The changes include increased temperatures,3 reduced snowpack,44 earlier spring warmth,51 and streamflow.15 These climate changes have increased background tree mortality rates from 1955 to 2007 in old-growth conifer forests in California, Colorado, Utah, and the northwestern states12 and caused extensive piñon pine mortality in Arizona, Colorado, New Mexico, and Utah between 1989 and 2003.85

Climate factors contributed to increases in wildfire in the previous century. In mid-elevation conifer forests of the western United States, increases in spring and summer temperatures, earlier snowmelt, and longer summers increased fire frequency by 400% and burned area by 650% from 1970 to 2003.13 Multivariate analysis of wildfire across the western U.S. from 1916 to 2003 indicates that climate was the dominant factor controlling burned area, even during periods of human fire suppression.86 Reconstruction of fires of the past 400 to 3000 years in the western U.S.87,88 and in Yosemite and Sequoia National Parks in California89,90,91 confirm that temperature and drought are the dominant factors explaining fire occurrence.

Four different fire models project increases in fire frequency across extensive areas of the Southwest in this century.92,93,94,95 Multivariate statistical generalized additive models96,93 project extensive increases across the Southwest, but the models project decreases when assuming that climate alters patterns of net primary productivity. Logistic regressions95 project increases across most of California, except for some southern parts of the state, with average fire frequency increasing 37% to 74%. Linear regression models project up to a doubling of burned area in the southern Rockies by 2070 under emissions scenarios B1 or A2.94 The MC1 dynamic global vegetation model projects increases in fire frequencies on 40% of the area of the Southwest from 2000 to 2100 and decreases on 50% of the areas for emissions scenarios B1 and A2.92

Excessive wildfire destroys homes, exposes slopes to erosion and landslides, and threatens public health, causing economic damage.97,98,99,100 Further impacts to communities and various economies (local, state, and national) have been projected.95

New information and remaining uncertainties

Uncertainties in future projections derive from the inability of models to accurately simulate all past fire patterns, and from the different GCMs, emissions scenarios, and spatial resolutions used by different fire model projections. Fire projections depend highly on the spatial and temporal distributions of precipitation projections, which vary widely across GCMs. Although models generally project future increases in wildfire, uncertainty remains on the exact locations. Research groups continue to refine the fire models.

Assessment of confidence based on evidence

There is high confidence in this key message given the extensive evidence base and discussed uncertainties.

Confidence Level

Very High

Strong evidence (established theory, multiple sources, consistent results, well documented and accepted methods, etc.), high consensus

High

Moderate evidence (several sources, some consistency, methods vary and/or documentation limited, etc.), medium consensus

Medium

Suggestive evidence (a few sources, limited consistency, models incomplete, methods emerging, etc.), competing schools of thought

Low

Inconclusive evidence (limited sources, extrapolations, inconsistent findings, poor documentation and/or methods not tested, etc.), disagreement or lack of opinions among experts

Sea Level Rise and Coastal Damage

In the last 100 years, sea level has risen along the California coast by 6.7 to 7.9 inches.111 In the last decade, high tides on top of this sea level rise have contributed to new damage to infrastructure, such as the inundation of Highway 101 near San Francisco and backup of seawater into the San Francisco Bay Area sewage systems.

Although sea level along the California coast has been relatively constant since 1980, both global and relative Southwest sea levels are expected to increase at accelerated rates.111,112,113,114 During the next 30 years, the greatest impacts will be seen during high tides and storm events. Rising sea level will allow more wave energy to reach farther inland and extend high tide periods, worsening coastal erosion on bluffs and beaches and increasing flooding potential.25,115,116,117,118,119,120

The result will be impacts to the nation’s largest ocean-based economy, which is estimated at $46 billion annually.121,122 If adaptive action is not taken, coastal highways, bridges, and other transportation infrastructure (such as the San Francisco and Oakland airports) are at increased risk of flooding with a 16-inch rise in sea level in the next 50 years,123 an amount consistent with the 1 to 4 feet of expected global increase in sea level (see Ch. 2: Our Changing Climate, Key Message 10). In Los Angeles, sea level rise poses a threat to groundwater supplies and estuaries,116,124 by potentially contaminating groundwater with seawater, or increasing the costs to protect coastal freshwater aquifers.125

Figure 20.5: Coastal Risks Posed by Sea Level Rise and High Tides Coastal Risks Posed by Sea Level Rise and High Tides Details/Download

Projected increases in extreme coastal flooding as a result of sea level rise will increase human vulnerability to coastal flooding events. Currently, 260,000 people in California are at risk from what is considered a once-in-100-year flood.116 With a sea level rise of about three feet (in the range of projections for this century – Ch. 2: Our Changing Climate, Key Message 10)111,113 and at current population densities, 420,000 people would be at risk from the same kind of 100-year flood event,121 based on existing exposure levels. Highly vulnerable populations – people less able to prepare, respond, or recover from natural disaster due to age, race, or income – make up approximately 18% of the at-risk population (Ch. 25: Coasts).121,126

The California state government, through its Ocean and Coastal Resources Adaptation Strategy, along with local governments, is using new sea level mapping and information about social vulnerability to undertake coastal adaptation planning. NOAA has created an interactive map showing areas that would be affected by sea level rise (http://www.csc.noaa.gov/slr/viewer/#).

Key Message 5: Heat Threats to Health

Projected regional temperature increases, combined with the way cities amplify heat, will pose increased threats and costs to public health in southwestern cities, which are home to more than 90% of the region’s population. Disruptions to urban electricity and water supplies will exacerbate these health problems.

Supporting Evidence
close

Supporting Evidence

Process for Developing Key Messages:

A central component of the assessment process was the Southwest Regional Climate assessment workshop that was held August 1-4, 2011, in Denver, CO with more than 80 participants in a series of scoping presentations and workshops. The workshop began the process leading to a foundational Technical Input Report (TIR) report.41 The TIR consists of nearly 800 pages organized into 20 chapters that were assembled by 122 authors representing a wide range of inputs, including governmental agencies, non-governmental organizations, tribes, and other entities. The report findings were described in a town hall meeting at the American Geophysical Union’s annual fall meeting in 2011, and feedback was collected and incorporated into the draft.

The chapter author team engaged in multiple technical discussions through more than 15 biweekly teleconferences that permitted a careful review of the foundational TIR41 and of approximately 125 additional technical inputs provided by the public, as well as the other published literature and professional judgment. The chapter author team then met at the University of Southern California on March 27-28, 2012, for expert deliberation of draft key messages by the authors. Each key message was defended before the entire author team prior to the key message being selected for inclusion. These discussions were supported by targeted consultation with additional experts by the lead author of each message, and they were based on criteria that help define “key vulnerabilities, which include magnitude, timing, persistence and reversibility, likelihood and confidence, potential for adaptation, distribution, and importance of the vulnerable system.”42

Over the past 50 years, there has been a reduction in the amount of snow measured on April 1 as a proportion of the precipitation falling in the corresponding water-year (October to September), which affects the timing of snowfed rivers. The implication of this finding is that the lower the proportion of April 1 snow water equivalent in the water-year-to-date precipitation, the more rapid the runoff, and the earlier the timing of center-of-mass of streamflow in snowfed rivers.43,44 For the “recent decade” (2001 to 2010), snowpack evidence is from U.S. Department of Agriculture (USDA) Natural Resources Conservation Service snow course data, updated through 2010. One study5 has analyzed streamflow amounts for the region’s four major river basins, the Colorado, Sacramento-San Joaquin, Great Basin (Humboldt River, NV), and the Rio Grande; data are from the U.S. Department of the Interior – Bureau of Reclamation, California Department of Water Resources, U.S. Geological Survey, and the International Boundary and Water Commission (U.S. Section), respectively. These data are backed by a rigorous detection and attribution study.15 Projected trends25 make use of downscaled climate parameters for 16 global climate models (GCMs), and hydrologic projections for the Colorado River, Rio Grande, and Sacramento-San Joaquin River System.

Based on GCM projections, downscaled and run through the variable infiltration capacity (VIC) hydrological model,45 there are projected reductions in spring snow accumulation and total annual runoff, leading to reduced surface water supply reliability for much of the Southwest, with greater impacts occurring during the second half of this century.25,46,47

Future flows in the four major Southwest rivers are projected to decline as a result of a combination of increased temperatures, increased evaporation, less snow, and less persistent snowpack. These changes have been projected to result in decreased surface water supplies, which will have impacts for allocation of water resources to major uses, such as urban drinking water, agriculture, and ecosystem flows.

Description of evidence base

There is excellent agreement regarding the urban heat island effect and exacerbation of heat island temperatures by increases in regional temperatures caused by climate change. There is abundant evidence of urban heat island effect for some Southwest cities (for example, Sheridan et al.127,128,129), as well as several studies, some from outside the region, of the public health threats of urban heat to residents (for example, Ch. 9: Human Health,130,131). Evidence includes observed urban heat island studies and modeling of future climates, including some climate change modeling studies for individual urban areas (for example, Phoenix and Los Angeles). There is wide agreement in Southwest states that increasing temperatures combined with projected population growth will stress urban water supplies and require continued water conservation and investment in new water supply options. There is substantial agreement that disruption to urban electricity may cause cascading impacts, such as loss of water, and that projected diminished supplies will pose challenges for urban cooling (for example, the need for supplemental irrigation for vegetation-based cooling). However, there are no studies on urban power disruption induced by climate change.

With projected surface water losses, and increasing water demand due to increasing temperatures and population, water supply in Southwest cities will require greater conservation efforts and capital investment in new water supply sources.132 Several southwestern states, including California, New Mexico, and Colorado have begun to study climate impacts to water resources, including impacts in urban areas.133,134

The interdependence of infrastructure systems is well established, especially the dependence of systems on electricity and communications and control infrastructures, and the potential cascading effects of breakdowns in infrastructure systems.22,23 The concentration of infrastructures in urban areas adds to the vulnerability of urban populations to infrastructure breakdowns. This has been documented in descriptions for major power outages such as the Northeast power blackout of 2003, or the recent September 2011 San Diego blackout.135

A few references point to the role of urban power outages in threatening public health due to loss of air conditioning19,21 and disruption to water supplies.135

New information and remaining uncertainties

Key uncertainties include the intensity and spatial extent of drought and heat waves. Uncertainty is also associated with quantification of the impact of temperature and water availability on energy generation, transmission, distribution, and consumption – all of which have an impact on possible disruptions to urban electricity. Major disruptions are contingent on a lack of operator response and/or adaptive actions such as installation of adequate electricity-generating capacity to serve the expected enhanced peak electricity demand. Thus a further uncertainty is the extent to which adaptation actions are taken.

Assessment of confidence based on evidence

The urban heat island effect is well demonstrated and hence projected climate-induced increases to heat will increase exposure to heat-related illness. Electricity disruptions are a key uncertain factor, and potential reductions in water supply not only may reduce hydropower generation, but also availability of water for cooling of thermal power plants.

Based on the substantial evidence and the remaining uncertainties, confidence in each aspect of the key message is high.

Confidence Level

Very High

Strong evidence (established theory, multiple sources, consistent results, well documented and accepted methods, etc.), high consensus

High

Moderate evidence (several sources, some consistency, methods vary and/or documentation limited, etc.), medium consensus

Medium

Suggestive evidence (a few sources, limited consistency, models incomplete, methods emerging, etc.), competing schools of thought

Low

Inconclusive evidence (limited sources, extrapolations, inconsistent findings, poor documentation and/or methods not tested, etc.), disagreement or lack of opinions among experts

Heat Threats to Health

The Southwest has the highest percentage of its population living in cities of any U.S. region. Its urban population rate, 92.7%, is 12% greater than the national average.136Increasing metropolitan populations already pose challenges to providing adequate domestic water supplies, and the combination of increased population growth and projected increased risks to surface water supplies will add further challenges.133,132,134 Tradeoffs are inevitable between conserving water to help meet the demands of an increasing population and providing adequate water for urban greenery to reduce increasing urban temperatures.

Urban infrastructures are especially vulnerable because of their interdependencies; strains in one system can cause disruptions in another (Ch. 11: Urban, Key Message 2; Ch. 9: Human Health).22,23,137 For example, an 11-minute power system disturbance in September 2011 cascaded into outages that left 1.5 million San Diego residents without power for 12 hours;135 the outage disrupted pumps and water service, causing 1.9 million gallons of sewage to spill near beaches.138 Extensive use of air conditioning to deal with high temperatures can quickly increase electricity demand and trigger cascading energy system failures, resulting in blackouts or brownouts.19,20,21,24

Figure 20.6: Urban Heat and Public Health Urban Heat and Public Health Details/Download

Heat stress, a recurrent health problem for urban residents, has been the leading weather-related cause of death in the United States since 1986, when record keeping began139 – and the highest rates nationally are found in Arizona.140 The effects of heat stress are greatest during heat waves lasting several days or more, and heat waves are projected to increase in frequency, duration, and intensity,16,18,127,128,129 become more humid,16 and cause a greater number of deaths.130 Already, severe heat waves, such as the 2006 ten-day California event, have resulted in high mortality, especially among elderly populations.131 In addition, evidence indicates a greater likelihood of impacts in less affluent neighborhoods, which typically lack shade trees and other greenery and have reduced access to air conditioning.141,142,143

Exposure to excessive heat can also aggravate existing human health conditions, like for those who suffer from respiratory or heart disease.130 Increased temperatures can reduce air quality, because atmospheric chemical reactions proceed faster in warmer conditions. The outcome is that heat waves are often accompanied by increased ground-level ozone,144 which can cause respiratory distress. Increased temperatures and longer warm seasons will also lead to shifts in the distribution of disease-transmitting mosquitoes (Ch. 9: Human Health, Key Message 1).140

References

  1. Ababneh, L., 2008: Bristlecone pine paleoclimatic model for archeological patterns in the White Mountain of California. Quaternary International, 188, 59-78, doi:10.1016/j.quaint.2007.08.041. | Detail

  2. Abatzoglou, J. T., and C. A. Kolden, 2011: Climate change in western US deserts: Potential for increased wildfire and invasive annual grasses. Rangeland Ecology & Management, 64, 471-478, doi:10.2111/rem-d-09-00151.1. | Detail

  3. Allen, C. D., and D. D. Breshears, 1998: Drought-induced shift of a forest-woodland ecotone: Rapid landscape response to climate variation. Proceedings of the National Academy of Sciences, 95, 14839-14842, doi:10.1073/pnas.95.25.14839. URL | Detail

  4. Allen, C. D. et al., 2010: A global overview of drought and heat-induced tree mortality reveals emerging climate change risks for forests. Forest Ecology and Management, 259, 660-684, doi:10.1016/j.foreco.2009.09.001. URL | Detail

  5. ,, 2012: Infrastructure Report Card for California. American Society of Civil Engineers. URL | Detail

  6. Ault, T. R., A. K. Macalady, G. T. Pederson, J. L. Betancourt, and M. D. Schwartz, 2011: Northern hemisphere modes of variability and the timing of spring in western North America. Journal of Climate, 24, 4003-4014, doi:10.1175/2011jcli4069.1. URL | Detail

  7. Averyt, K., J. Macknick, J. Rogers, N. Madden, J. Fisher, J. Meldrum, and R. Newmark, 2013: Water use for electricity in the United States: An analysis of reported and calculated water use information for 2008. Environmental Research Letters, 8, 015001, doi:10.1088/1748-9326/8/1/015001. URL | Detail

  8. Baldocchi, D., and S. Wong, 2008: Accumulated winter chill is decreasing in the fruit growing regions of California. Climatic Change, 87, 153-166, doi:10.1007/s10584-007-9367-8. | Detail

  9. Barnett, T. P., D. W. Pierce, H. G. Hidalgo, C. Bonfils, B. D. Santer, T. Das, G. Bala, A. W. Wood, T. Nozawa, A. A. Mirin, D. R. Cayan, and M. D. Dettinger, 2008: Human-induced changes in the hydrology of the western United States. Science, 319, 1080-1083, doi:10.1126/science.1152538. URL | Detail

  10. Battisti, D. S., and R. L. Naylor, 2009: Historical warnings of future food insecurity with unprecedented seasonal heat. Science, 323, 240-244, doi:10.1126/science.1164363. | Detail

  11. Beach, R. H., C. Zhen, A. Thomson, R. M. Rejesus, P. Sinha, A. W. Lentz, D. V. Vedenov, and B. A. McCarl, 2010: Climate Change Impacts on Crop Insurance. DIANE Publishing, 215 pp. | Detail

  12. Bentz, B. J., J. Regniere, C. J. Fettig, E. M. Hansen, J. L. Hayes, J. A. Hicke, R. G. Kelsey, J. F. Negron, and S. J. Seybold, 2010: Climate change and bark beetles of the Western United States and Canada: Direct and indirect effects. BioScience, 60, 602-613, doi:10.1525/Bio.2010.60.8.6. URL | Detail

  13. Bloetscher, F., D. E. Meeroff, B. N. Heimlich, A. R. Brown, D. Bayler, and M. Loucraft, 2010: Improving resilience against the effects of climate change. American Water Works Association, 102, 36-46. | Detail

  14. Bonfils, C., B. D. Santer, D. W. Pierce, H. G. Hidalgo, G. Bala, T. Das, T. P. Barnett, D. R. Cayan, C. Doutriaux, A. W. Wood, A. Mirin, and T. Nozawa, 2008: Detection and attribution of temperature changes in the mountainous western United States. Journal of Climate, 21, 6404-6424, doi:10.1175/2008JCLI2397.1. URL | Detail

  15. Bowman, D. M. J. S. et al., 2009: Fire in the Earth system. Science, 324, 481-484, doi:10.1126/science.1163886. | Detail

  16. Breshears, D. D., N. S. Cobb, P. M. Rich, K. P. Price, C. D. Allen, R. G. Balice, W. H. Romme, J. H. Kastens, M. L. Floyd, J. Belnap, J. J. Anderson, O. B. Myers, and C. W. Meyer, 2005: Regional vegetation die-off in response to global-change-type drought. Proceedings of the National Academy of Sciences, 102, 15144-15148, doi:10.1073/pnas.0505734102. URL | Detail

  17. Bromirski, P. D., , , , and M. Tyree, 2012: Coastal Flooding Potential Projections: 2000–2100. California Energy Commission. CEC-500-2012-011. 53 pp., California Energy Commission's California Climate Change Center, Scripps Institute of Oceanography. URL | Detail

  18. Bromirski, P. D., A. J. Miller, R. E. Flick, and G. Auad, 2011: Dynamical suppression of sea level rise along the Pacific coast of North America: Indications for imminent acceleration. Journal of Geophysical Research, 116, C07005, doi:10.1029/2010JC006759. URL | Detail

  19. Brown, H. E., A. Comrie, D. Drechsler, C. M. Barker, R. Basu, T. Brown, A. Gershunov, A. M. Kilpatrick, W. K. Reisen, and D. M. Ruddell, 2013: Ch. 15: Human health. Assessment of Climate Change in the Southwest United States: A Report Prepared for the National Climate Assessment, G. Garfin, Jardine, A., Merideth, R., Black, M., and LeRoy, S., Eds., Island Press, 312-339. URL | Detail

  20. ,, 2009: Ch. 5: Managing for an Uncertain Future. California Water Plan Update 2009. Integrated Water Management. Volume 1 - The Strategic Plan,, State of California, 5-1 - 5-36. URL | Detail

  21. ,, 2011: 2011 Integrated Energy Policy Report. Publication Number: CEC-100-2011-001-CMF. 221 pp. URL | Detail

  22. Cayan, D., K. Kunkel, C. Castro, A. Gershunov, J. Barsugli, A. Ray, J. Overpeck, M. Anderson, J. Russell, B. Rajagopalan, I. Rangwala, and P. Duffy, 2013: Ch. 6: Future climate: Projected average. Assessment of Climate Change in the Southwest United States: A Report Prepared for the National Climate Assessment, G. Garfin, Jardine, A., Merideth, R., Black, M., and LeRoy, S., Eds., Island Press, 153-196. URL | Detail

  23. Cayan, D. R., A. L. Luers, G. Franco, M. Hanemann, B. Croes, and E. Vine, 2008: Overview of the California climate change scenarios project. Climatic Change, 87, 1-6, doi:10.1007/s10584-007-9352-2. | Detail

  24. Cayan, D. R., T. Das, D. W. Pierce, T. P. Barnett, M. Tyree, and A. Gershunov, 2010: Future dryness in the southwest US and the hydrology of the early 21st century drought. Proceedings of the National Academy of Sciences, 107, 21271-21276, doi:10.1073/pnas.0912391107. URL | Detail

  25. Christensen, N., and D. P. Lettenmaier, 2006: A multimodel ensemble approach to assessment of climate change impacts on the hydrology and water resources of the Colorado River Basin. Hydrology and Earth System Sciences, 3, 3727-3770, doi:10.5194/hessd-3-3727-2006. | Detail

  26. Clemmer, S., J. Rogers, S. Sattler, J. Macknick, and T. Mai, 2013: Modeling low-carbon US electricity futures to explore impacts on national and regional water use. Environmental Research Letters, 8, 015004, doi:10.1088/1748-9326/8/1/015004. URL | Detail

  27. Cook, E. R., R. Seager, R. R. Heim, R. S. Vose, C. Herweijer, and C. Woodhouse, 2010: Megadroughts in North America: Placing IPCC projections of hydroclimatic change in a long-term palaeoclimate context. Journal of Quaternary Science, 25, 48-61, doi:10.1002/jqs.1303. URL | Detail

  28. Cooley, H., E. Moore, M. Heberger, and L. Allen, 2012: Social Vulnerability to Climate Change in California. California Energy Commission. Publication Number: CEC-500-2012-013. 69 pp., Pacific Institute, Oakland, CA. URL | Detail

  29. Cozzetto, K., K. Chief, K. Dittmer, M. Brubaker, R. Gough, K. Souza, F. Ettawageshik, S. Wotkyns, S. Opitz-Stapleton, S. Duren, and P. Chavan, 2013: Climate change impacts on the water resources of American Indians and Alaska Natives in the U.S. Climatic Change, 120, 569-584, doi:10.1007/s10584-013-0852-y. | Detail

  30. Cutter, S. L., B. J. Boruff, and W. L. Shirley, 2003: Social vulnerability to environmental hazards. Social Science Quarterly, 84, 242-261, doi:10.1111/1540-6237.8402002. | Detail

  31. Dettinger, M., 2011: Climate change, atmospheric rivers, and floods in California–a multimodel analysis of storm frequency and magnitude changes. Journal of the American Water Resources Association, 47, 514-523, doi:10.1111/j.1752-1688.2011.00546.x. | Detail

  32. Dettinger, M. D., F. M. Ralph, T. Das, P. J. Neiman, and D. R. Cayan, 2011: Atmospheric rivers, floods and the water resources of California. Water, 3, 445-478, doi:10.3390/w3020445. URL | Detail

  33. ,, 2012: SunShot Vision Study. DOE/GO-102012-3037. 320 pp., U.S. Department of Energy. URL | Detail

  34. ,, and , 2012: Arizona-Southern California Outages on September 8, 2011: Causes and Recommendations. April 2012. 151 pp., Federal Energy Regulatory Commission, North American Electric Reliability Corporation. URL | Detail

  35. Finney, M. A., C. W. McHugh, and I. C. Grenfell, 2005: Stand-and landscape-level effects of prescribed burning on two Arizona wildfires. Canadian Journal of Forest Research, 35, 1714-1722, doi:10.1139/X05-090. URL | Detail

  36. Frisvold, G., X. Ma, and S. Ponnaluru, 2011: Ch. 6: Climate, water availability, energy costs, and national park visitation. Adaptation and Resilience: The Economics of Climate, Water, and Energy Challenges in the American Southwest, B.G. Colby and Frisvold, G.B., Eds., RFF Press., 256. | Detail

  37. Frisvold, G., L. E. Jackson, J. G. Pritchett, and J. Ritten, 2013: Ch. 11: Agriculture and ranching. Assessment of Climate Change in the Southwest United States: A Report Prepared for the National Climate Assessment, G. Garfin, Jardine, A., Merideth, R., Black, M., and LeRoy, S., Eds., Island Press, 218-239. URL | Detail

  38. Garfin, G., A. Jardine, R. Merideth, M. Black, and J. Overpeck, 2012: Assessment of Climate Change in the Southwest United States: a Technical Report Prepared for the U.S. National Climate Assessment. A report by the Southwest Climate Alliance. Southwest Climate Alliance. | Detail

  39. Gautam, M. R., K. Chief, and W. J. Smith, Jr., 2013: Climate change in arid lands and Native American socioeconomic vulnerability: The case of the Pyramid Lake Paiute Tribe. Climatic Change, 120, 585-599, doi:10.1007/s10584-013-0737-0. URL | Detail

  40. Gershunov, A., Z. Johnston, H. G. Margolis, and K. Guirguis, 2011: The California heat wave 2006 with impacts on statewide medical emergency: A space-time analysis. Geography Research Forum, 31, 6-31. | Detail

  41. Gershunov, A., D. R. Cayan, and S. F. Iacobellis, 2009: The great 2006 heat wave over California and Nevada: Signal of an increasing trend. Journal of Climate, 22, 6181-6203, doi:10.1175/2009jcli2465.1. URL | Detail

  42. Gleick, P. H., 2010: Roadmap for sustainable water resources in southwestern North America. Proceedings of the National Academy of Sciences, 107, 21300-21305, doi:10.1073/pnas.1005473107. URL | Detail

  43. Gonzalez, P., R. P. Neilson, J. M. Lenihan, and R. J. Drapek, 2010: Global patterns in the vulnerability of ecosystems to vegetation shifts due to climate change. Global Ecology and Biogeography, 19, 755-768, doi:10.1111/j.1466-8238.2010.00558.x. URL | Detail

  44. Graumlich, L. J., 1993: A 1000-year record of temperature and precipitation in the Sierra Nevada. Quaternary Research, 39, 249-255, doi:10.1006/qres.1993.1029. | Detail

  45. Grossman-Clarke, S., J. A. Zehnder, T. Loridan, and C. S. B. Grimmond, 2010: Contribution of land use changes to near-surface air temperatures during recent summer extreme heat events in the Phoenix metropolitan area. Journal of Applied Meteorology and Climatology, 49, 1649-1664, doi:10.1175/2010JAMC2362.1. URL | Detail

  46. Harlan, S. L., A. J. Brazel, L. Prashad, W. L. Stefanov, and L. Larsen, 2006: Neighborhood microclimates and vulnerability to heat stress. Social Science & Medicine, 63, 2847-2863, doi:10.1016/j.socscimed.2006.07.030. | Detail

  47. Hatfield, J., K. Boote, P. Fay, L. Hahn, C. Izaurralde, B. A. Kimball, T. Mader, J. Morgan, D. Ort, W. Polley, A. Thompson, and D. Wolfe, 2008: Ch. 2: Agriculture. The Effects of Climate Change on Agriculture, Land Resources, and Biodiversity in the United States. A Report by the U.S. Climate Change Science Program and the Subcommittee on Global Change Research, P. Backlund et al., Eds., U.S. Department of Agriculture, 21-74. URL | Detail

  48. Hayhoe, K., M. Robson, J. Rogula, M. Auffhammer, N. Miller, J. VanDorn, and D. Wuebbles, 2010: An integrated framework for quantifying and valuing climate change impacts on urban energy and infrastructure: A Chicago case study. Journal of Great Lakes Research, 36, 94-105, doi:10.1016/j.jglr.2010.03.011. | Detail

  49. Heberger, M., H. Cooley, P. Herrera, P. H. Gleick, and E. Moore, 2011: Potential impacts of increased coastal flooding in California due to sea-level rise. Climatic Change, 109, 229-249, doi:10.1007/s10584-011-0308-1. | Detail

  50. Hidalgo, H. G., T. Das, M. D. Dettinger, D. R. Cayan, D. W. Pierce, T. P. Barnett, G. Bala, A. Mirin, A. W. Wood, C. Bonfils, B. D. Santer, and T. Nozawa, 2009: Detection and attribution of streamflow timing changes to climate change in the western United States. Journal of Climate, 22, 3838-3855, doi:10.1175/2009jcli2470.1. URL | Detail

  51. Hoerling, M. P., M. Dettinger, K. Wolter, J. Lukas, J. Eischeid, R. Nemani, B. Liebmann, and K. E. Kunkel, 2013: Ch. 5: Present weather and climate: Evolving conditions. Assessment of Climate Change in the Southwest United States: A Report Prepared for the National Climate Assessment, G. Garfin, Jardine, A., Merideth, R., Black, M., and LeRoy, S., Eds., Island Press, 74-97. URL | Detail

  52. Hurteau, M. D., G. W. Koch, and B. A. Hungate, 2008: Carbon protection and fire risk reduction: Toward a full accounting of forest carbon offsets. Frontiers in Ecology and the Environment, 6, 493-498, doi:10.1890/070187. | Detail

  53. Hurteau, M. D., and M. L. Brooks, 2011: Short- and long-term effects of fire on carbon in US dry temperate forest systems. BioScience, 61, 139-146, doi:10.1525/bio.2011.61.2.9. URL | Detail

  54. Ingram, H., D. Feldman, N. Mantua, K. L. Jacobs, D. Fort, N. Beller-Simms, and A. M. Waple, 2008: Ch. 1: The changing context. Decision-Support Experiments and Evaluations Using Seasonal-to-Interannual Forecasts and Observational Data: A Focus on Water Resources. A Report by the U.S. Climate Change Science Program and the Subcommittee on Global Change Research, N. Beller-Simms, Ingram, H., Feldman, D., Mantua, N., Jacobs, K.L., and Waple, A.M., Eds., U.S. Climate Change Science Program, 7-28. | Detail

  55. ,, 2007: Climate Change 2007: Impacts, Adaptation and Vulnerability. Contribution of Working Group II to the Fourth Assessment Report of the Intergovernmental Panel on Climate Change. Cambridge University Press, 976 pp. | Detail

  56. Jackson, L., V. R. Haden, S. M. Wheeler, A. D. Hollander, J. Perlman, T. O’Geen, V. K. Mehta, V. Clark, and J. Williams, 2012: Vulnerability and Adaptation to Climate Change in California Agriculture. A White Paper from the California Energy Commission’s California Climate Change Center (PIER Program). Publication number: CEC-500-2012-031. 106 pp., Sacramento, California Energy Commission. URL | Detail

  57. Jackson, L. E., S. M. Wheeler, A. D. Hollander, A. T. O’Geen, B. S. Orlove, J. Six, D. A. Sumner, F. Santos-Martin, J. B. Kramer, W. R. Horwath, R. E. Howitt, and T. P. Tomich, 2011: Case study on potential agricultural responses to climate change in a California landscape. Climatic Change, 109, 407-427, doi:10.1007/s10584-011-0306-3. | Detail

  58. Karl, T. R., J. T. Melillo, and T. C. Peterson, 2009: Global Climate Change Impacts in the United States. T.R. Karl, Melillo, J.T., and Peterson, T.C., Eds. Cambridge University Press, 189 pp. URL | Detail

  59. Keeley, J. E., and P. H. Zedler, 2009: Large, high-intensity fire events in southern California shrublands: Debunking the fine-grain age patch model. Ecological Applications, 19, 69-94, doi:10.1890/08-0281.1. | Detail

  60. Keeley, J. E., and T. J. Brennan, 2012: Fire-driven alien invasion in a fire-adapted ecosystem. Oecologia, 169, 1043-1052, doi:10.1007/s00442-012-2253-8. | Detail

  61. Kenny, J. F., N. L. Barber, S. S. Hutson, K. S. Linsey, J. K. Lovelace, and M. A. Maupin, 2009: Estimated Use of Water in the United States in 2005. U.S. Geological Survey Circular 1344. 52 pp., U.S. Geological Survey, Reston, VA. URL | Detail

  62. Kildow, J., and C. S. Colgan, 2005: California’s Ocean Economy: Report to the Resources Agency, State of California. 167 pp., The National Ocean Economics Program, Monterey, CA. URL | Detail

  63. King, C. W., A. S. Holman, and M. E. Webber, 2008: Thirst for energy. Nature Geoscience, 1, 283-286, doi:10.1038/ngeo195. | Detail

  64. Kodra, E., K. Steinhaeuser, and A. R. Ganguly, 2011: Persisting cold extremes under 21st-century warming scenarios. Geophysical Research Letters, 38, L08705, doi:10.1029/2011GL047103. | Detail

  65. Krawchuk, M. A., M. A. Moritz, M. A. Parisien, J. Van Dorn, and K. Hayhoe, 2009: Global pyrogeography: The current and future distribution of wildfire. PLoS ONE, 4, e5102, doi:10.1371/journal.pone.0005102. URL | Detail

  66. Kunkel, K. E., L. E. Stevens, S. E. Stevens, L. Sun, E. Janssen, D. Wuebbles, K. T. Redmond, and J. G. Dobson, 2013: Regional Climate Trends and Scenarios for the U.S. National Climate Assessment: Part 5. Climate of the Southwest U.S. NOAA Technical Report NESDIS 142-5. 87 pp., National Oceanic and Atmospheric Administration, National Environmental Satellite, Data, and Information Service, Washington, D.C. URL | Detail

  67. Liang, X., D. P. Lettenmaier, E. F. Wood, and S. J. Burges, 1994: A simple hydrologically based model of land surface water and energy fluxes for general circulation models. Journal of Geophysical Research, 99, 14415-14428, doi:10.1029/94JD00483. URL | Detail

  68. Litschert, S. E., T. C. Brown, and D. M. Theobald, 2012: Historic and future extent of wildfires in the Southern Rockies Ecoregion, USA. Forest Ecology and Management, 269, 124-133, doi:10.1016/j.foreco.2011.12.024. | Detail

  69. Littell, J. S., D. McKenzie, D. L. Peterson, and A. L. Westerling, 2009: Climate and wildfire area burned in western US ecoprovinces, 1916-2003. Ecological Applications, 19, 1003-1021, doi:10.1890/07-1183.1. | Detail

  70. Lobell, D. B., C. B. Field, K. N. Cahill, and C. Bonfils, 2006: Impacts of future climate change on California perennial crop yields: Model projections with climate and crop uncertainties. Agricultural and Forest Meteorology, 141, 208-218, doi:10.1016/j.agrformet.2006.10.006. | Detail

  71. Luedeling, E., E. H. Girvetz, M. A. Semenov, and P. H. Brown, 2011: Climate change affects winter chill for temperate fruit and nut trees. PLoS ONE, 6, e20155, doi:10.1371/journal.pone.0020155. URL | Detail

  72. Macknick, J., S. Sattler, K. Averyt, S. Clemmer, and J. Rogers, 2012: The water implications of generating electricity: Water use across the United States based on different electricity pathways through 2050. Environmental Research Letters, 7, 045803, doi:10.1088/1748-9326/7/4/045803. URL | Detail

  73. Marlon, J. R., P. J. Bartlein, D. G. Gavin, C. J. Long, R. S. Anderson, C. E. Briles, K. J. Brown, D. Colombaroli, D. J. Hallett, M. J. Power, E. A. Scharf, and M. K. Walsh, 2012: Long-term perspective on wildfires in the western USA. Proceedings of the National Academy of Sciences, 109, E535-E543, doi:10.1073/pnas.1112839109. URL | Detail

  74. Mazur, A., and T. Metcalfe, 2012: America’s three electric grids: Are efficiency and reliability functions of grid size? Electric Power Systems Research, 89, 191-195, doi:10.1016/j.epsr.2012.03.005. | Detail

  75. Means, III, E., M. Laugier, J. Daw, L. Kaatz, and M. Waage, 2010: Decision Support Planning Methods: Incorporating Climate Change Uncertainties Into Water Planning. Water Utility Climate Alliance White Paper. 113 pp., Water Utility Alliance, San Francisco, CA. URL | Detail

  76. Medellín-Azuara, J., R. E. Howitt, D. J. MacEwan, and J. R. Lund, 2012: Economic impacts of climate-related changes to California agriculture. Climatic Change, 109, 387-405, doi:10.1007/s10584-011-0314-3. | Detail

  77. Medina, J., 2011: Human error investigated in California blackout’s spread to six million. The New York Times. URL | Detail

  78. Meko, D. M., C. A. Woodhouse, C. A. Baisan, T. Knight, J. J. Lukas, M. K. Hughes, and M. W. Salzer, 2007: Medieval drought in the upper Colorado River Basin. Geophysical Research Letters, 34, 10705, doi:1029/2007GL029988. URL | Detail

  79. Millar, C. I., J. C. King, R. D. Westfall, H. A. Alden, and D. L. Delany, 2006: Late Holocene forest dynamics, volcanism, and climate change at Whitewing Mountain and San Joaquin Ridge, Mono County, Sierra Nevada, CA, USA. Quaternary Research, 66, 273-287, doi:10.1016/j.yqres.2006.05.001. URL | Detail

  80. Miller, N. L., K. Hayhoe, J. Jin, and M. Auffhammer, 2008: Climate, extreme heat, and electricity demand in California. Journal of Applied Meteorology and Climatology, 47, 1834-1844, doi:10.1175/2007jamc1480.1. URL | Detail

  81. Millstein, D. E., and R. A. Harley, 2009: Impact of climate change on photochemical air pollution in Southern California. Atmospheric Chemistry and Physics, 9, 3745-3754, doi:10.5194/acp-9-3745-2009. URL | Detail

  82. Milly, P. C. D., J. Betancourt, M. Falkenmark, R. M. Hirsch, Z. W. Kundzewicz, D. P. Lettenmaier, and R. J. Stouffer, 2008: Stationarity is dead: Whither water management? Science, 319, 573-574, doi:10.1126/science.1151915. | Detail

  83. Min, H. S. J., W. Beyeler, T. Brown, Y. J. Son, and A. T. Jones, 2007: Toward modeling and simulation of critical national infrastructure interdependencies. IIE Transactions, 39, 57-71, doi:10.1080/07408170600940005. URL | Detail

  84. Moritz, M. A., M. A. Parisien, E. Batllori, M. A. Krawchuk, J. Van Dorn, D. J. Ganz, and K. Hayhoe, 2012: Climate change and disruptions to global fire activity. Ecosphere, 3, 1-22, doi:10.1890/ES11-00345.1. URL | Detail

  85. Morton, D. C., M. E. Roessing, A. E. Camp, and M. L. Tyrrell, 2003: Assessing the Environmental, Social, and Economic Impacts of Wildfire. 59 pp., Yale University, School of Forestry and Environmental Studies, Global Institute of Sustainable Forestry, New Haven, CT. URL | Detail

  86. Neiman, P. J., F. M. Ralph, G. A. Wick, J. D. Lundquist, and M. D. Dettinger, 2008: Meteorological characteristics and overland precipitation impacts of atmospheric rivers affecting the west coast of North America based on eight years of SSM/I satellite observations. Journal of Hydrometeorology, 9, 22-47, doi:10.1175/2007JHM855.1. URL | Detail

  87. Nelson, J., J. Johnston, A. Mileva, M. Fripp, I. Hoffman, A. Petros-Good, C. Blanco, and D. M. Kammen, 2012: High-resolution modeling of the western North American power system demonstrates low-cost and low-carbon futures. Energy Policy, 43, 436-447, doi:10.1016/j.enpol.2012.01.031. | Detail

  88. ,, 2002: Making the Nation Safer: The Role of Science and Technology in Countering Terrorism. National Research Council, Committee on Science and Technology for Countering Terrorism. The National Academies Press, 417 pp. URL | Detail

  89. ,, 2012: Sea-Level Rise for the Coasts of California, Oregon, and Washington: Past, Present, and Future. National Research Council, Committee on Sea Level Rise in California, Oregon, Washington, Board on Earth Sciences Resources, Ocean Studies Board, Division on Earth Life Studies The National Academies Press, 201 pp. URL | Detail

  90. ,, 2012: Weather Fatalities. URL | Detail

  91. Ostro, B., S. Rauch, and S. Green, 2011: Quantifying the health impacts of future changes in temperature in California. Environmental Research, 111, 1258-1264, doi:10.1016/j.envres.2011.08.013. | Detail

  92. Ostro, B. D., L. A. Roth, R. S. Green, and R. Basu, 2009: Estimating the mortality effect of the July 2006 California heat wave. Environmental Research, 109, 614-619, doi:10.1016/j.envres.2009.03.010. URL | Detail

  93. Painter, T. H., J. S. Deems, J. Belnap, A. F. Hamlet, C. C. Landry, and B. Udall, 2010: Response of Colorado River runoff to dust radiative forcing in snow. Proceedings of the National Academy of Sciences, 107, 17125-17130, doi:10.1073/pnas.0913139107. URL | Detail

  94. Painter, T. H., A. P. Barrett, C. C. Landry, J. C. Neff, M. P. Cassidy, C. R. Lawrence, K. E. McBride, and G. L. Farmer, 2007: Impact of disturbed desert soils on duration of mountain snow cover. Geophysical Research Letters, 34, L12502, doi:10.1029/2007GL030284. URL | Detail

  95. Parris, A., P. Bromirski, V. Burkett, D. Cayan, M. Culver, J. Hall, R. Horton, K. Knuuti, R. Moss, J. Obeysekera, A. Sallenger, and J. Weiss, 2012: Global Sea Level Rise Scenarios for the United States National Climate Assessment. NOAA Tech Memo OAR CPO-1. 37 pp., National Oceanic and Atmospheric Administration, Silver Spring, MD. URL | Detail

  96. Pendleton, L. H., 2009: The economic value of coastal and estuary recreation. The Economic and Market Value of Coasts and Estuaries: What's At Stake?, L.H. Pendleton, Ed., Coastal Ocean Values Press, 115-139. URL | Detail

  97. Pierce, D. W., T. P. Barnett, H. G. Hidalgo, T. Das, C. Bonfils, B. D. Santer, G. Bala, M. D. Dettinger, D. R. Cayan, A. Mirin, A. W. Wood, and T. Nozawa, 2008: Attribution of declining western US snowpack to human effects. Journal of Climate, 21, 6425-6444, doi:10.1175/2008JCLI2405.1. URL | Detail

  98. Pincetl, S., T. Gillespie, D. E. Pataki, S. Saatchi, and J. D. Saphores, 2012: Urban tree planting programs, function or fashion? Los Angeles and urban tree planting campaigns. GeoJournal, 1-19, doi:10.1007/s10708-012-9446-x. | Detail

  99. Pritchett, J., 2011: Quantification Task, a Description of Agriculture Production and Water Transfers in the Colorado River Basin: A Report to the CRB Water Sharing Working Group and the Walton Family Foundation. Colorado Water Institute, Colorado State University, 27 pp. URL | Detail

  100. Purkey, D. R., B. Joyce, S. Vicuna, M. W. Hanemann, L. L. Dale, D. Yates, and J. A. Dracup, 2008: Robust analysis of future climate change impacts on water for agriculture and other sectors: A case study in the Sacramento Valley. Climatic Change, 87, 109-122, doi:10.1007/s10584-007-9375-8. | Detail

  101. Qian, Y., W. I. Gustafson, Jr., L. R. Leung, and S. J. Ghan, 2009: Effects of soot-induced snow albedo change on snowpack and hydrological cycle in western United States based on weather research and forecasting chemistry and regional climate simulations. Journal of Geophysical Research, 114, D03108, doi:10.1029/2008JD011039. URL | Detail

  102. Raffa, K. F., B. H. Aukema, B. J. Bentz, A. L. Carroll, J. A. Hicke, M. G. Turner, and W. H. Romme, 2008: Cross-scale drivers of natural disturbances prone to anthropogenic amplification: The dynamics of bark beetle eruptions. BioScience, 58, 501-517, doi:10.1641/b580607. URL | Detail

  103. Ray, A. J., J. J. Barsugli, K. B. Averyt, K. Wolter, M. Hoerling, N. Doesken, B. Udall, and R. S. Webb, 2008: Climate Change in Colorado: A Synthesis to Support Water Resources Management and Adaptation. Report for the Colorado Water Conservation Board. 58 pp., University of Colorado, Boulder, CO. URL | Detail

  104. ,, 2012: Colorado River Basin Water Supply and Demand Study. Study report. December 2012. Prepared by the Colorado River Basin Water Supply and Demand Study Team. 95 pp., U.S. Department of the Interior, Bureau of Reclamation, Denver, CO. URL | Detail

  105. ,, 2011: Reclamation Managing Water in the West. SECURE Water Act Section 9503(c) - Reclamation Climate Change and Water 2011. 226 pp., U.S. Department of the Interior, U.S. Bureau of Reclamation, Denver, CO. URL | Detail

  106. Revell, D. L., R. Battalio, B. Spear, P. Ruggiero, and J. Vandever, 2011: A methodology for predicting future coastal hazards due to sea-level rise on the California Coast. Climatic Change, 109, 251-276, doi:10.1007/s10584-011-0315-2. | Detail

  107. Richardson, L. A., P. A. Champ, and J. B. Loomis, 2012: The hidden cost of wildfires: Economic valuation of health effects of wildfire smoke exposure in Southern California. Journal of Forest Economics, 18, 14-35, doi:10.1016/j.jfe.2011.05.002. | Detail

  108. Rinaldi, S. M., J. P. Peerenboom, and T. K. Kelly, 2001: Identifying, understanding, and analyzing critical infrastructure interdependencies. Control Systems, IEEE, 21, 11-25, doi:10.1109/37.969131. | Detail

  109. Rockaway, T. D., P. A. Coomes, J. Rivard, and B. Kornstein, 2011: Residential water use trends in North America. Journal: American Water Works Association, 103, 76-89. | Detail

  110. Romanovsky, V. E., S. L. Smith, H. H. Christiansen, N. I. Shiklomanov, D. S. Drozdov, N. G. Oberman, A. L. Kholodov, and S. S. Marchenko, 2011: Permafrost. Arctic Report Card 2011,, 139-147. URL | Detail

  111. Routson, C. C., C. A. Woodhouse, and J. T. Overpeck, 2011: Second century megadrought in the Rio Grande headwaters, Colorado: How unusual was medieval drought? Geophysical Research Letters, 38, L22703, doi:10.1029/2011gl050015. URL | Detail

  112. Salzer, M. W., and K. F. Kipfmueller, 2005: Reconstructed temperature and precipitation on a millennial timescale from tree-rings in the southern Colorado plateau, USA. Climatic Change, 70, 465-487, doi:10.1007/s10584-005-5922-3. URL | Detail

  113. Salzer, M. W., M. K. Hughes, A. G. Bunn, and K. F. Kipfmueller, 2009: Recent unprecedented tree-ring growth in bristlecone pine at the highest elevations and possible causes. Proceedings of the National Academy of Sciences, 106, 20348-20353, doi:10.1073/pnas.0903029106. URL | Detail

  114. Sarche, M., and P. Spicer, 2008: Poverty and health disparities for American Indian and Alaska Native children. Annals of the New York Academy of Sciences, 1136, 126-136, doi:10.1196/annals.1425.017. URL | Detail

  115. Schneider, S. H., S. Semenov, A. Patwardhan, I. Burton, C. H. D. Magadza, M. Oppenheimer, A. B. Pittock, A. Rahman, J. B. Smith, A. Suarez, and F. Yamin, 2007: Ch. 19: Assessing key vulnerabilities and the risk from climate change. Climate Change 2007: Impacts, Adaptation and Vulnerability. Contribution of Working Group II to the Fourth Assessment Report of the Intergovernmental Panel on Climate Change, M.L. Parry, Canziani, O.F., Palutikof, J.P., Van der Linden, P.J., and Hanson, C.E., Eds., Cambridge University Press, 779-810. | Detail

  116. ,, 2011: Living with a Rising Bay: Vulnerability and Adaptation in San Francisco Bay and on its Shoreline. 187 pp., San Francisco Bay Conservation and Development Commission, San Francisco, CA. URL | Detail

  117. Sheridan, S., C. Lee, M. Allen, and L. Kalkstein, 2011: A Spatial Synoptic Classification Approach to Projected Heat Vulnerability in California Under Future Climate Change Scenarios. Final Report to the California Air Resources Board. Research Contract 07-304. 155 pp., California Air Resources Board and the California Environmental Protection Agency. URL | Detail

  118. Sheridan, S. C., C. C. Lee, M. J. Allen, and L. S. Kalkstein, 2012: Future heat vulnerability in California, Part I: Projecting future weather types and heat events. Climatic Change, 115, 291-309, doi:10.1007/s10584-012-0436-2. | Detail

  119. Sheridan, S. C., M. J. Allen, C. C. Lee, and L. S. Kalkstein, 2012: Future heat vulnerability in California, Part II: Projecting future heat-related mortality. Climatic Change, 115, 311-326, doi:10.1007/s10584-012-0437-1. | Detail

  120. Soden, D. L., 2006: At the Cross Roads: US/Mexico Border Counties in Transition. IPED Technical Report 2006-1. Institute for Policy and Economic Development, University of Texas, El Paso, TX. URL | Detail

  121. Stevens, M. B., J. F. González-Rouco, and H. Beltrami, 2008: North American climate of the last millennium: Underground temperatures and model comparison. Journal of Geophysical Research, 113, F01008, doi:10.1029/2006JF000705. | Detail

  122. Storlazzi, C. D., and G. B. Griggs, 2000: Influence of El Niño–Southern Oscillation (ENSO) events on the evolution of central California’s shoreline. Geological Society of America Bulletin, 112, 236-249, doi:10.1130/0016-7606(2000)1122.0.CO;2. | Detail

  123. Strzepek, K., G. Yohe, J. Neumann, and B. Boehlert, 2010: Characterizing changes in drought risk for the United States from climate change. Environmental Research Letters, 5, 044012, doi:10.1088/1748-9326/5/4/044012. URL | Detail

  124. Swetnam, T. W., C. H. Baisan, A. C. Caprio, P. M. Brown, R. Touchan, R. S. Anderson, and D. J. Hallett, 2009: Multi-millennial fire history of the Giant Forest, Sequoia National Park, California, USA. Fire Ecology, 5, 120-150, doi:10.4996/fireecology.0503120. | Detail

  125. Swetnam, T. W., 1993: Fire history and climate change in giant sequoia groves. Science, 262, 885-889, doi:10.1126/science.262.5135.885. | Detail

  126. Tanaka, S. K., T. Zhu, J. R. Lund, R. E. Howitt, M. W. Jenkins, M. A. Pulido, M. Tauber, R. S. Ritzema, and I. C. Ferreira, 2006: Climate warming and water management adaptation for California. Climatic Change, 76, 361-387, doi:10.1007/s10584-006-9079-5. | Detail

  127. Taylor, A. H., and A. E. Scholl, 2012: Climatic and human influences on fire regimes in mixed conifer forests in Yosemite National Park, USA. Forest Ecology and Management, 267, 144-156, doi:10.1016/j.foreco.2011.11.026. | Detail

  128. Trouet, V., A. H. Taylor, E. R. Wahl, C. N. Skinner, and S. L. Stephens, 2010: Fire-climate interactions in the American West since 1400 CE. Geophysical Research Letters, 37, L04702, doi:10.1029/2009GL041695. URL | Detail

  129. ,, 2012: 2010 Census Urban and Rural Classification and Urban Area Criteria. URL | Detail

  130. Udall, B., 2013: Ch. 10: Water: Impacts, risks, and adaptation. Assessment of Climate Change in the Southwest United States: A Report Prepared for the National Climate Assessment, G. Garfin, Jardine, A., Merideth, R., Black, M., and LeRoy, S., Eds., Island Press, 197–217. URL | Detail

  131. ,, 2009: United States Summary and State Data. In 2007 Census of Agriculture, Vol. 1, Geographic Area Series, Part 51. AC-07-A-51. 739 pp., U.S. Department of Agriculture, Washington, D.C. URL | Detail

  132. ,, 2010: Farm and Ranch Irrigation Survey (2008). In 2007 Census of Agriculture, Vol. 3, Special Studies, Part 1. AC-07-SS-1. 268 pp., U.S. Department of Agriculture, Washington, D.C. URL | Detail

  133. Van Mantgem, P. J., N. L. Stephenson, J. C. Byrne, L. D. Daniels, J. F. Franklin, P. Z. Fule, M. E. Harmon, A. J. Larson, J. M. Smith, A. H. Taylor, and T. T. Veblen, 2009: Widespread increase of tree mortality rates in the western United States. Science, 323, 521-524, doi:10.1126/science.1165000. | Detail

  134. van Vliet, M. T. H., J. R. Yearsley, F. Ludwig, S. Vogele, D. P. Lettenmaier, and P. Kabat, 2012: Vulnerability of US and European electricity supply to climate change. Nature Climate Change, 2, 676-681, doi:10.1038/nclimate1546. | Detail

  135. Webb, M. D., and K. W. F. Howard, 2011: Modeling the transient response of saline intrusion to rising sea-levels. Ground Water, 49, 560-569, doi:10.1111/j.1745-6584.2010.00758.x. | Detail

  136. Wei, M., J. H. Nelson, M. Ting, C. Yang, J. Greenblatt, and J. McMahon, 2012: California’s Carbon Challenge. Scenarios for Achieving 80% Emissions Reductions in 2050. Lawrence Berkeley National Laboratory, UC Berkeley, UC Davis, and Itron to the California Energy Commission. URL | Detail

  137. Wei, M., N. H. James, G. B. Jeffery, M. Ana, J. Josiah, T. Michael, Y. Christopher, J. Chris, M. M. E. James, and K. M. Daniel, 2013: Deep carbon reductions in California require electrification and integration across economic sectors. Environmental Research Letters, 8, 014038, doi:10.1088/1748-9326/8/1/014038. URL | Detail

  138. Westerling, A. L., H. G. Hidalgo, D. R. Cayan, and T. W. Swetnam, 2006: Warming and earlier spring increase western U.S. forest wildfire activity. Science, 313, 940-943, doi:10.1126/science.1128834. | Detail

  139. Westerling, A. L., B. P. Bryant, H. K. Preisler, T. P. Holmes, H. G. Hidalgo, T. Das, and S. R. Shrestha, 2011: Climate change and growth scenarios for California wildfire. Climatic Change, 109, 445-463, doi:10.1007/s10584-011-0329-9. | Detail

  140. ,, 2010: The True Cost of Wildfire in the Western U.S. 15 pp., Western Forestry Leadership Coalition, Lakewood, CO. URL | Detail

  141. Wilbanks, T., S. Fernandez, G. Backus, P. Garcia, K. Jonietz, P. Kirshen, M. Savonis, B. Solecki, and L. Toole, 2012: Climate Change and Infrastructure, Urban Systems, and Vulnerabilities. Technical Report to the U.S. Department of Energy in Support of the National Climate Assessment. 119 pp., Oak Ridge National Laboratory. U.S. Department of Energy, Office of Science, Oak Ridge, TN. URL | Detail

  142. Wilder, M., G. Garfin, P. Ganster, H. Eakin, P. Romero-Lankao, F. Lara-Valencia, A. A. Cortez-Lara, S. Mumme, C. Neri, and F. Munoz-Arriola, 2013: Ch. 16: Climate change and U.S.-Mexico border communities. Assessment of Climate Change in the Southwest United States: A Report Prepared for the National Climate Assessment, G. Garfin, Jardine, A., Merideth, R., Black, M., and LeRoy, S., Eds., Island Press, 340–384. URL | Detail

  143. Williams, A. P., C. D. Allen, C. I. Millar, T. W. Swetnam, J. Michaelsen, C. J. Still, and S. W. Leavitt, 2010: Forest responses to increasing aridity and warmth in the southwestern United States. Proceedings of the National Academy of Sciences, 107, 21289-21294, doi:10.1073/pnas.0914211107. URL | Detail

  144. Woodhouse, C. A., D. M. Meko, G. M. MacDonald, D. W. Stahle, and E. R. Cook, 2010: A 1,200-year perspective of 21st century drought in southwestern North America. Proceedings of the National Academy of Sciences, 107, 21283-21288, doi:10.1073/pnas.0911197107. URL | Detail

The National Climate Assessment summarizes the impacts of climate change on the United States, now and in the future.

A team of more than 300 experts guided by a 60-member Federal Advisory Committee produced the report, which was extensively reviewed by the public and experts, including federal agencies and a panel of the National Academy of Sciences.

United States Global Change Research Program logo United States Global Change Research Program participating agency logos