Introduction
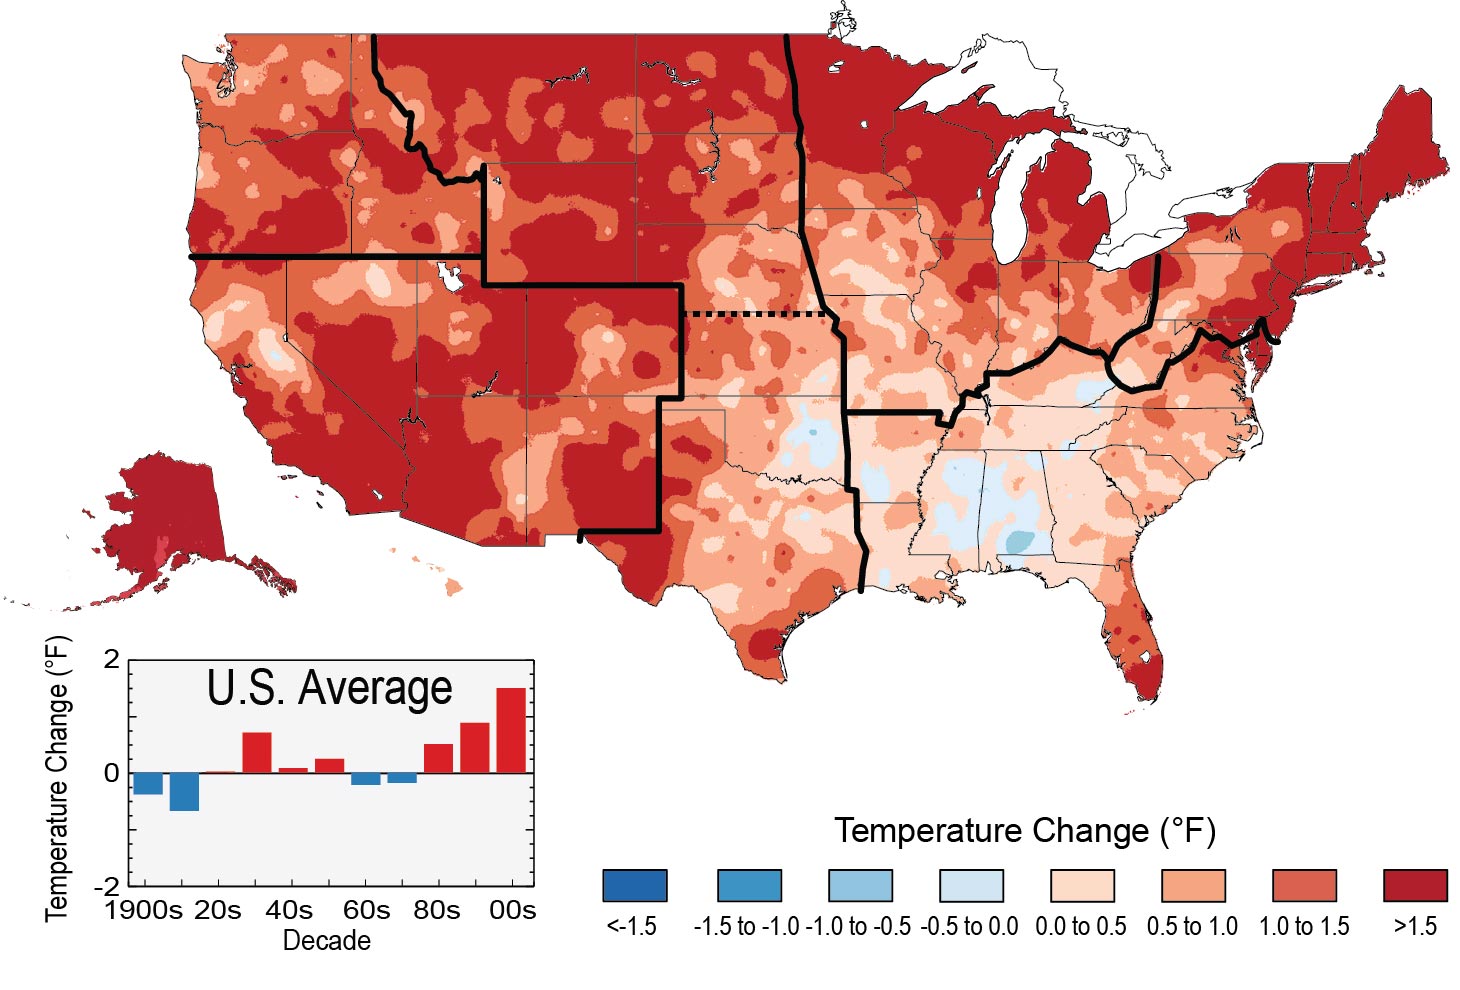
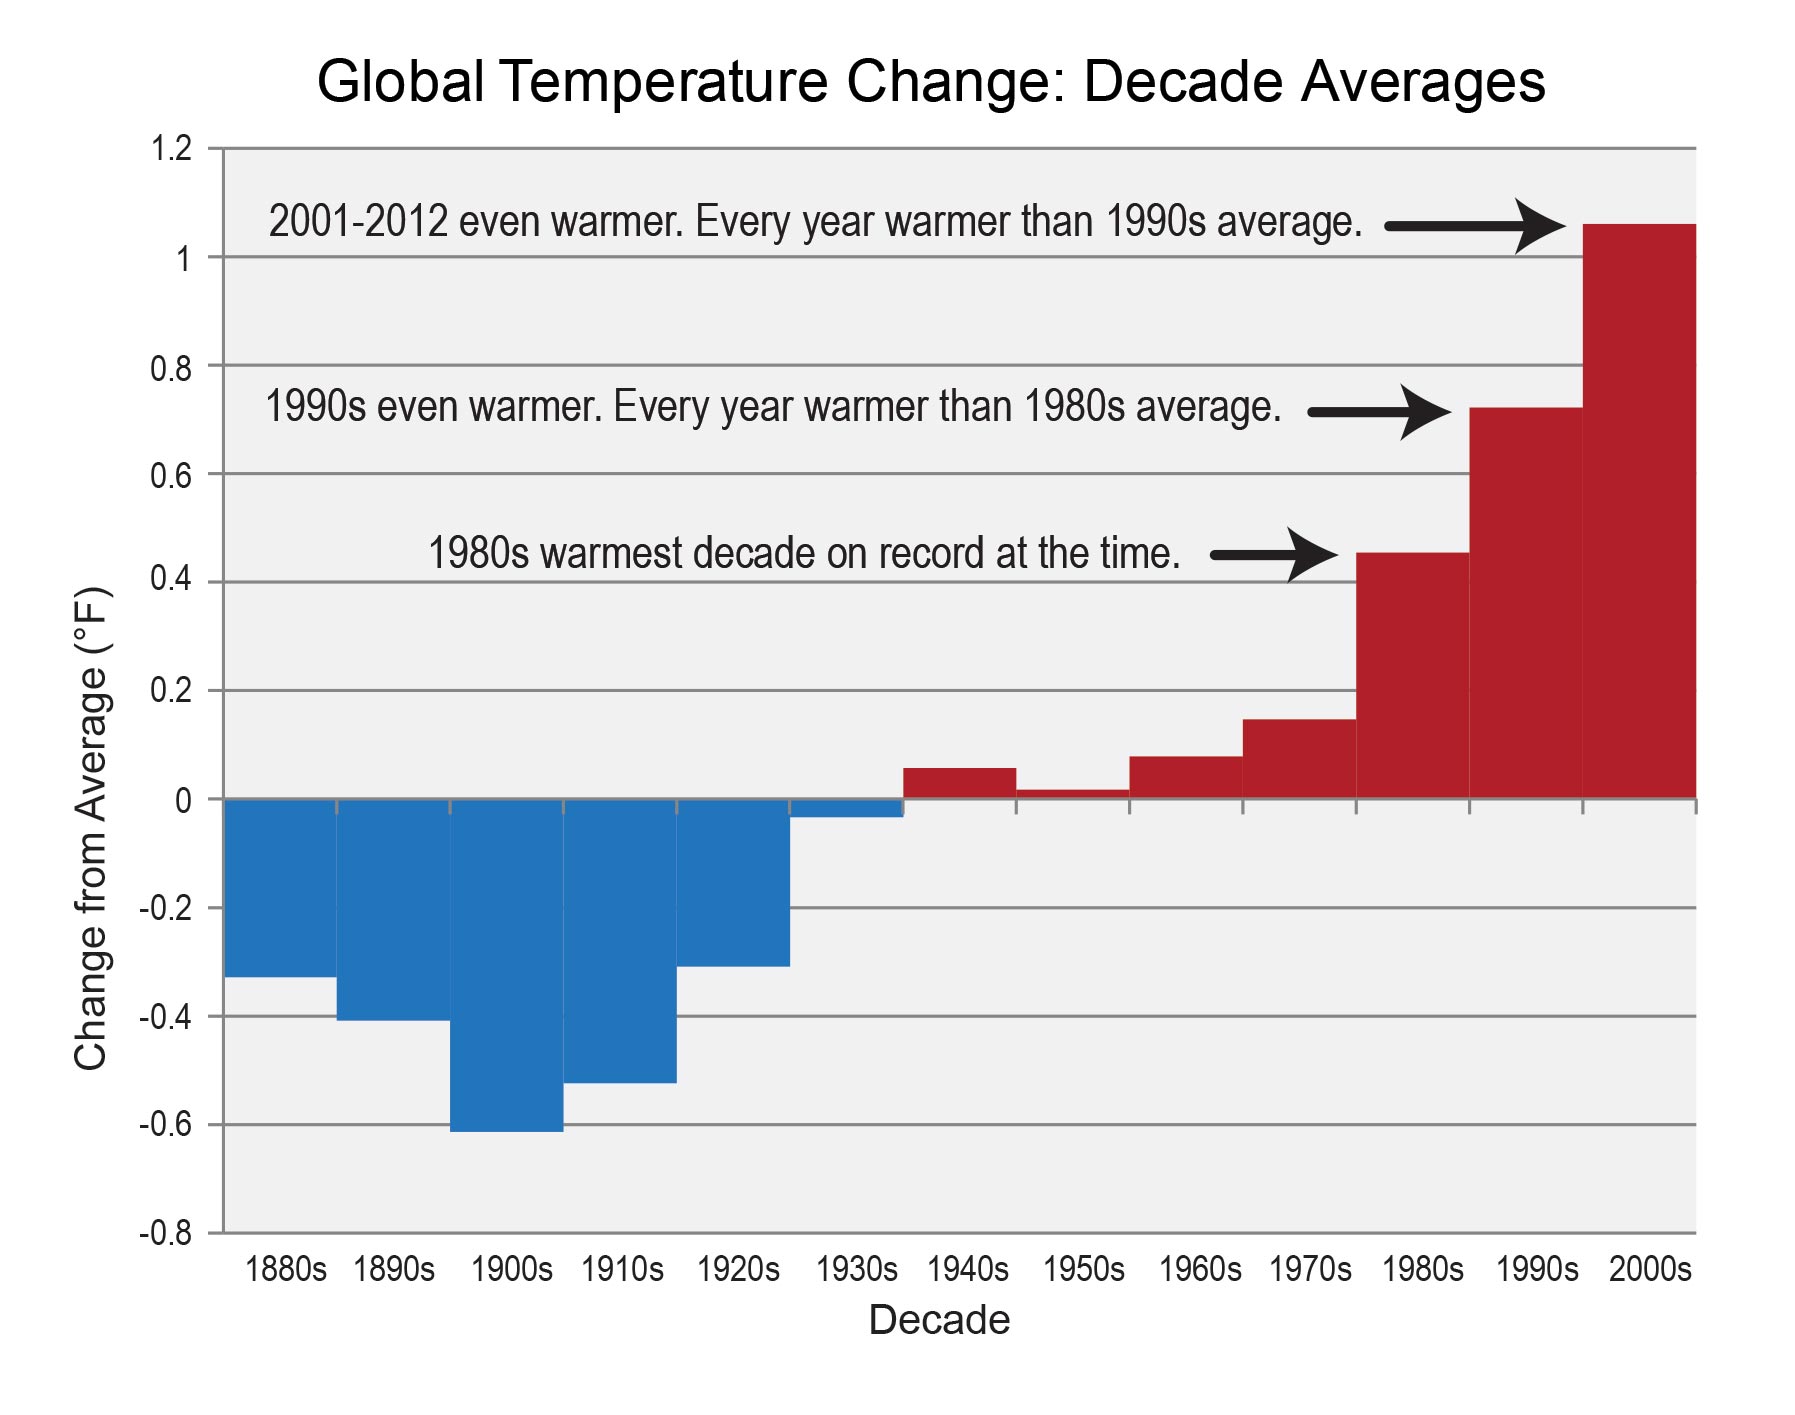
Temperature Change by Decade
![Temperature Change by Decade]()
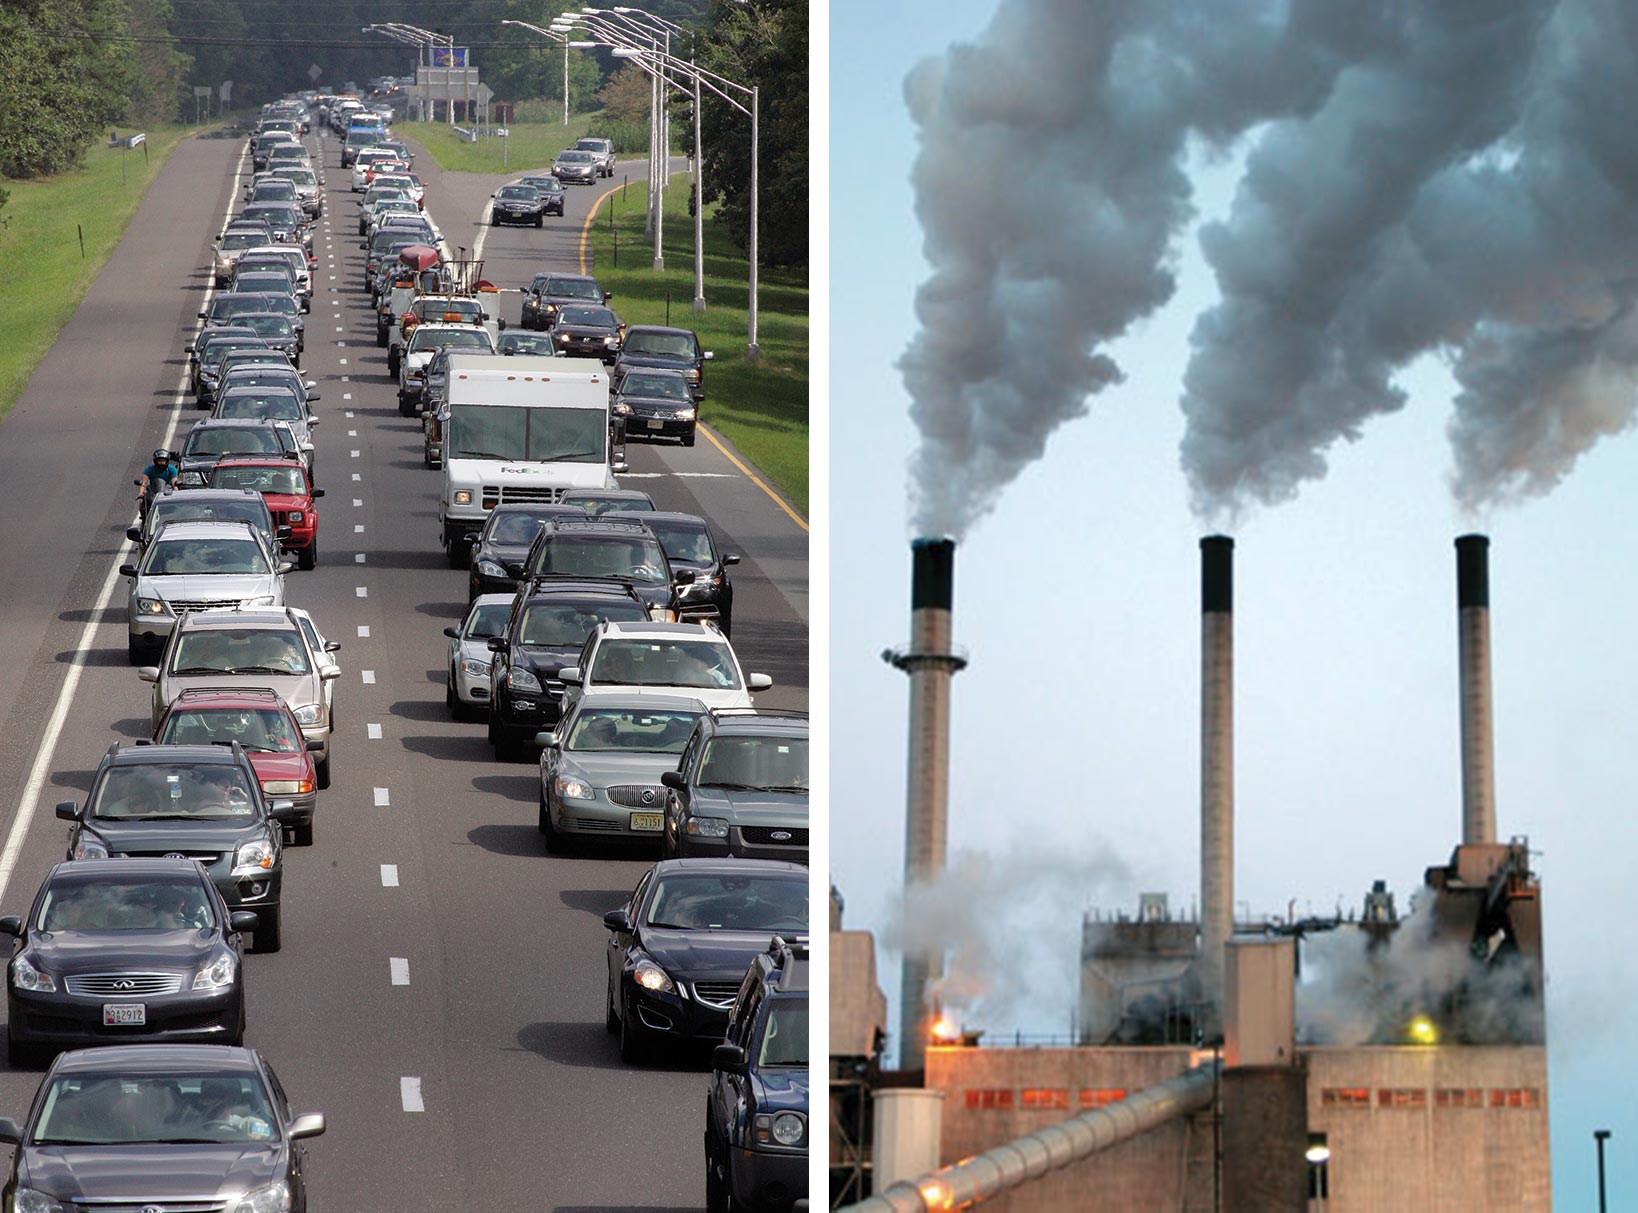
Evidence for changes in Earth’s climate can be found from the top of the atmosphere to the depths of the oceans. Researchers from around the world have compiled this evidence using satellites, weather balloons, thermometers at surface stations, and many other types of observing systems that monitor the Earth’s weather and climate. The sum total of this evidence tells an unambiguous story: the planet is warming.