This website is the digital version of the 2014 National Climate Assessment, produced in collaboration with the U.S. Global Change Research Program.

For the official version, please refer to the PDF in the downloads section. The downloadable PDF is the official version of the 2014 National Climate Assessment.

Credits | Site Map

Search Options

X

Search form

Top

Welcome to the National Climate Assessment

The National Climate Assessment summarizes the impacts of climate change on the United States, now and in the future.

A team of more than 300 experts guided by a 60-member Federal Advisory Committee produced the report, which was extensively reviewed by the public and experts, including federal agencies and a panel of the National Academy of Sciences.

Explore the effects of climate change
United States Global Change Research Program logo
United States Department of Agriculture logo United States Department of Commerce logo United States Department of Defense logo United States Department of Energy logo United States Department of Health and Human Services logo United States Department of the Interior logo United States Department of State logo United States Department of Transportation logo United States Environmental Protection Agency logo National Aeronautics and Space Administration logo National Science Foundation logo Smithsonian Institution logo United States Agency for International Development logo

Mitigation

The amount of future climate change will largely be determined by choices society makes about emissions. Lower emissions of heat trapping gases mean less future warming and less severe impacts. Emissions can be reduced through improved energy efficiency and switching to low-carbon or non-carbon energy sources.

Explore mitigation – ways of reducing future climate change.

Next

Convening Lead Authors

Henry D. Jacoby, Massachusetts Institute of Technology

Anthony C. Janetos, Boston University

Lead Authors

Richard Birdsey, U.S. Forest Service

James Buizer, University of Arizona

Katherine Calvin, Pacific Northwest National Laboratory, University of Maryland

Francisco de la Chesnaye, Electric Power Research Institute

David Schimel, NASA Jet Propulsion Laboratory

Ian Sue Wing, Boston University

Contributing Authors

Reid Detchon, United Nations Foundation

Jae Edmonds, Pacific Northwest National Laboratory, University of Maryland

Lynn Russell, Scripps Institution of Oceanography, University of California, San Diego

Jason West, University of North Carolina

Introduction

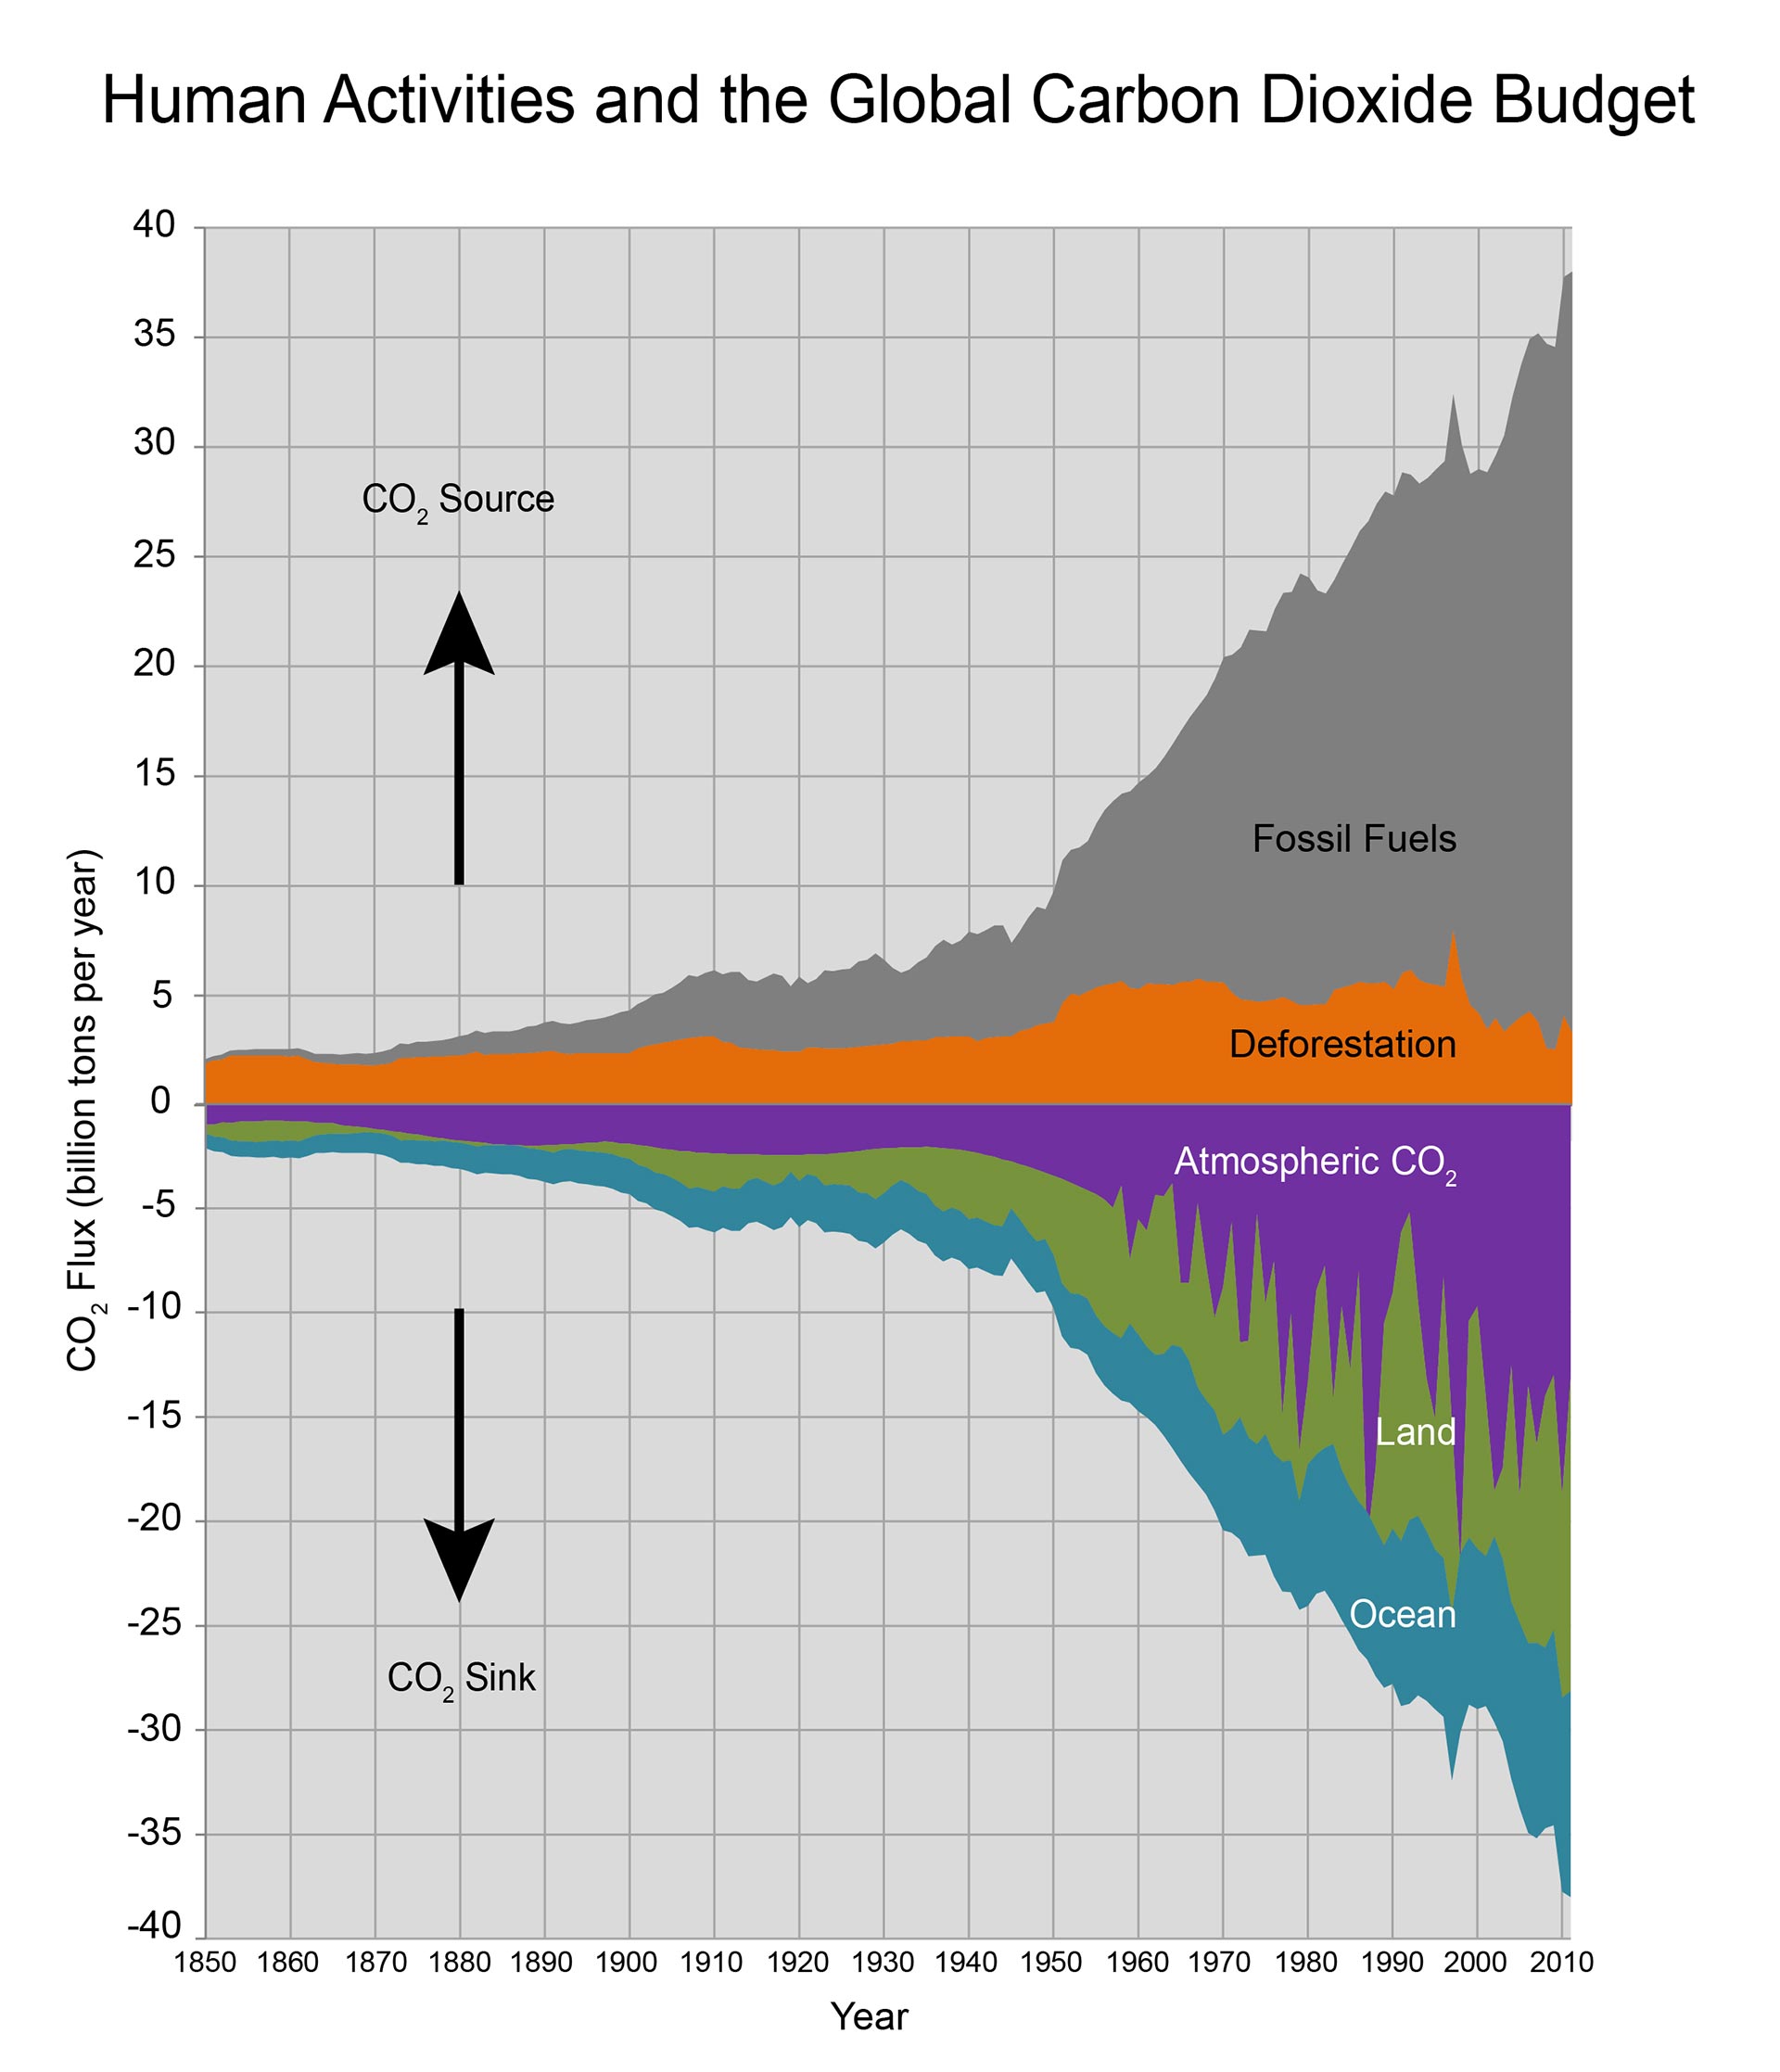
Mitigation refers to actions that reduce the human contribution to the planetary greenhouse effect. Mitigation actions include lowering emissions of greenhouse gases like carbon dioxide and methane, and particles like black carbon (soot) that have a warming effect. Increasing the net uptake of carbon dioxide through land-use change and forestry can make a contribution as well. As a whole, human activities result in higher global concentrations of greenhouse gases and to a warming of the planet – and the effect is increased by various self-reinforcing cycles in the Earth system (such as the way melting sea ice results in more dark ocean water, which absorbs more heat, and leads to more sea ice loss). Also, the absorption of increased carbon dioxide by the oceans is leading to increased ocean acidity with adverse effects on marine ecosystems.

Four mitigation-related topics are assessed in this chapter. First, it presents an overview of greenhouse gas emissions and their climate influence to provide a context for discussion of mitigation efforts. Second, the chapter provides a survey of activities contributing to U.S. emissions of carbon dioxide and other greenhouse gases. Third, it provides a summary of current government and voluntary efforts to manage these emissions. Finally, there is an assessment of the adequacy of these efforts relative to the magnitude of the climate change threat and a discussion of preparation for potential future action. While the chapter presents a brief overview of mitigation issues, it does not provide a comprehensive discussion of policy options, nor does it attempt to review or analyze the range of technologies available to reduce emissions.

These topics have also been the subject of other assessments, including those by the National Academy of Sciences53 and the U.S. Department of Energy.76 Mitigation topics are addressed throughout this report (see Ch. 4: Energy, Key Message 5; Ch. 5: Transportation, Key Message 4; Ch. 7: Forests, Key Message 4; Ch. 9: Human Health, Key Message 4; Ch. 10: Energy, Water, and Land, Key Messages 1, 2, 3; Ch. 13: Land Use & Land Cover Change, Key Messages 2, 4; Ch. 15: Biogeochemical Cycles, Key Message 3; Ch. 26: Decision Support, Key Messages 1, 2, 3; Appendix 3: Climate Science Supplemental Message 5; Appendix 4: FAQs N, S, X, Y, Z).

Emissions, Concentrations, and Climate Forcing

Setting mitigation objectives requires knowledge of the Earth system processes that determine the relationship among emissions, atmospheric concentrations and, ultimately, climate. Human-caused climate change results mainly from the increasing atmospheric concentrations of greenhouse gases.3 These gases cause radiative “forcing” – an imbalance of heat trapped by the atmosphere compared to an equilibrium state. Atmospheric concentrations of greenhouse gases are the result of the history of emissions and of processes that remove them from the atmosphere; for example, by “sinks” like growing forests.4 The fraction of emissions that remains in the atmosphere, which is different for each greenhouse gas, also varies over time as a result of Earth system processes.

The impact of greenhouse gases depends partly on how long each one persists in the atmosphere.5 Reactive gases like methane and nitrous oxide are destroyed chemically in the atmosphere, so the relationships between emissions and atmospheric concentrations are determined by the rate of those reactions. The term “lifetime” is often used to describe the speed with which a given gas is removed from the atmosphere. Methane has a relatively short lifetime (largely removed within a decade or so, depending on conditions), so reductions in emissions can lead to a fairly rapid decrease in concentrations as the gas is oxidized in the atmosphere.6 Nitrous oxide has a much longer lifetime, taking more than 100 years to be substantially removed.7 Other gases in this category include industrial gases, like those used as solvents and in air conditioning, some of which persist in the atmosphere for hundreds or thousands of years.

Carbon dioxide (CO2) does not react chemically with other gases in the atmosphere, so it does not, strictly speaking, have a “lifetime.”8 Instead, the relationship between emissions and concentrations from year to year is determined by patterns of release (for example, through burning of fossil fuels) and uptake (for example, by vegetation and by the ocean).9 Once CO2 is emitted from any source, a portion of it is removed from the atmosphere over time by plant growth and absorption by the oceans, after which it continues to circulate in the land-atmosphere-ocean system until it is finally converted into stable forms in soils, deep ocean sediments, or other geological repositories (Figure 27.1).

Figure 27.1: Human Activities and the Global Carbon Dioxide Budget Human Activities and the Global Carbon Dioxide Budget Details/Download

Of the carbon dioxide emitted from human activities in a year, about half is removed from the atmosphere by natural processes within a century, but around 20% continues to circulate and to affect atmospheric concentrations for thousands of years.10 Stabilizing or reducing atmospheric carbon dioxide concentrations, therefore, requires very deep reductions in future emissions – ultimately approaching zero – to compensate for past emissions that are still circulating in the Earth system. Avoiding future emissions, or capturing and storing them in stable geological storage, would prevent carbon dioxide from entering the atmosphere, and would have very long-lasting effects on atmospheric concentrations.

In addition to greenhouse gases, there can be climate effects from fine particles in the atmosphere. An example is black carbon (soot), which is released from coal burning, diesel engines, cooking fires, wood stoves, wildfires, and other combustion sources. These particles have a warming influence, especially when they absorb solar energy low in the atmosphere.11 Other particles, such as those formed from sulfur dioxide released during coal burning, have a cooling effect by reflecting some of the sun’s energy back to space or by increasing the brightness of clouds (see: Ch. 2: Our Changing Climate; Appendix 3: Climate Science Supplement; and Appendix 4: FAQs).

The effect of each gas is related to both how long it lasts in the atmosphere (the longer it lasts, the greater its influence) and its potency in trapping heat. The warming influence of different gases can be compared using “global warming potentials” (GWP), which combine these two effects, usually added up over a 100-year time period. Global warming potentials are referenced to carbon dioxide – which is defined as having a GWP of 1.0 – and the combined effect of multiple gases is denoted in carbon dioxide equivalents, or CO2-e.

The relationship between emissions and concentrations of gases can be modeled using Earth System Models.4 Such models apply our understanding of biogeochemical processes that remove greenhouse gas from the atmosphere to predict their future concentrations. These models show that stabilizing CO2 emissions would not stabilize its atmospheric concentrations but instead result in a concentration that would increase at a relatively steady rate. Stabilizing atmospheric concentrations of CO2 would require reducing emissions far below present-day levels. Concentration and emissions scenarios, such as the recently developed Representative Concentration Pathways (RCPs) and scenarios developed earlier by the Intergovernmental Panel on Climate Change’s (IPCC) Special Report on Emissions Scenarios (SRES), are used in Earth System Models to study potential future climates. The RCPs span a range of atmospheric targets for use by climate modelers,12,13 as do the SRES cases. These global analyses form a framework within which the climate contribution of U.S. mitigation efforts can be assessed. In this report, special attention is given to the SRES A2 scenario (similar to RCP 8.5), which assumes continued increases in emissions, and the SRES B1 scenario (close to RCP 4.5), which assumes a substantial reduction of emissions (Ch. 2: Our Changing Climate; Appendix 5: Scenarios and Models).

Geoengineering

Geoengineering has been proposed as a third option for addressing climate change in addition to, or alongside, mitigation and adaptation. Geoengineering refers to intentional modifications of the Earth system as a means to address climate change. Three types of activities have been proposed: 1) carbon dioxide removal (CDR), which boosts CO2 removal from the atmosphere by various means, such as fertilizing ocean processes and promoting land-use practices that help take up carbon, 2) solar radiation management (SRM), which reflects a small percentage of sunlight back into space to offset warming from greenhouse gases,14 and 3) direct capture and storage of CO2 from the atmosphere.15

Current research suggests that SRM or CDR could diminish the impacts of climate change. However, once undertaken, sudden cessation of SRM would exacerbate the climate effects on human populations and ecosystems, and some CDR might interfere with oceanic and terrestrial ecosystem processes.16 SRM undertaken by itself would not slow increases in atmospheric CO2 concentrations, and would therefore also fail to address ocean acidification. Furthermore, existing international institutions are not adequate to manage such global interventions. The risks associated with such purposeful perturbations to the Earth system are thus poorly understood, suggesting the need for caution and comprehensive research, including consideration of the implicit moral hazards.17

Key Message 1

Carbon dioxide is removed from the atmosphere by natural processes at a rate that is roughly half of the current rate of emissions from human activities. Therefore, mitigation efforts that only stabilize global emissions will not reduce atmospheric concentrations of carbon dioxide, but will only limit their rate of increase. The same is true for other long-lived greenhouse gases.

Supporting Evidence
close

Supporting Evidence

Process for Developing Key Messages:

Evaluation of literature by Coordinating Lead Authors

Description of evidence base

The message is a restatement of conclusions derived from the peer-reviewed literature over nearly the past 20 years (see Section 1 of chapter). Publications have documented the long lifetime of CO2 in the atmosphere, resulting in long time lags between action and reduction,9,10,18 and Earth System Models have shown that stabilizing emissions will not immediately stabilize atmospheric concentrations, which will continue to increase.4

New information and remaining uncertainties

There are several important uncertainties in the current carbon cycle, especially the overall size, location, and dynamics of the land-use sink9,10 and technological development and performance.

Simulating future atmospheric concentrations of greenhouse gases requires both assumptions about economic activity, stringency of any greenhouse gas emissions control, and availability of technologies, as well as a number of assumptions about how the changing climate system affects both natural and anthropogenic sources.

Assessment of confidence based on evidence

Very High. Observations of changes in the concentrations of greenhouse gases are consistent with our understanding of the broad relationships between emissions and concentrations.

Confidence Level

Very High

Strong evidence (established theory, multiple sources, consistent results, well documented and accepted methods, etc.), high consensus

High

Moderate evidence (several sources, some consistency, methods vary and/or documentation limited, etc.), medium consensus

Medium

Suggestive evidence (a few sources, limited consistency, models incomplete, methods emerging, etc.), competing schools of thought

Low

Inconclusive evidence (limited sources, extrapolations, inconsistent findings, poor documentation and/or methods not tested, etc.), disagreement or lack of opinions among experts

Key Message 2

To meet the lower emissions scenario (B1) used in this assessment, global mitigation actions would need to limit global carbon dioxide emissions to a peak of around 44 billion tons per year within the next 25 years and decline thereafter. In 2011, global emissions were around 34 billion tons, and have been rising by about 0.9 billion tons per year for the past decade. Therefore, the world is on a path to exceed 44 billion tons per year within a decade.

Supporting Evidence
close

Supporting Evidence

Process for Developing Key Messages:

Evaluation of literature by Coordinating Lead Authors

Description of evidence base

A large number of emissions scenarios have been modeled, with a number of publications showing what would be required to limit CO212,19,20,21 to any predetermined limit. At current concentrations and rate of rise, the emissions of CO2 would need to peak around 44 billion tons within the next 25 years in order to stabilize concentrations as in the B1 scenario. Given the rate of increase in recent years,1,2 this limit is expected to be surpassed.22

New information and remaining uncertainties

Uncertainties about the carbon cycle could affect these calculations, but the largest uncertainties are the assumptions made about the strength and cost of greenhouse gas emissions policies.

Assessment of confidence based on evidence

The confidence in the conclusion is high. This is a contingent conclusion, though – we do not have high confidence that the current emission rate will be sustained. However, we do have high confidence that if we do choose to limit concentrations as in the B1 scenario, emissions will need to peak soon and then decline.

Confidence Level

Very High

Strong evidence (established theory, multiple sources, consistent results, well documented and accepted methods, etc.), high consensus

High

Moderate evidence (several sources, some consistency, methods vary and/or documentation limited, etc.), medium consensus

Medium

Suggestive evidence (a few sources, limited consistency, models incomplete, methods emerging, etc.), competing schools of thought

Low

Inconclusive evidence (limited sources, extrapolations, inconsistent findings, poor documentation and/or methods not tested, etc.), disagreement or lack of opinions among experts

Key Message 3

Over recent decades, the U.S. economy has emitted a decreasing amount of carbon dioxide per dollar of gross domestic product. Between 2008 and 2012, there was also a decline in the total amount of carbon dioxide emitted annually from energy use in the United States as a result of a variety of factors, including changes in the economy, the development of new energy production technologies, and various government policies.

Supporting Evidence
close

Supporting Evidence

Process for Developing Key Messages:

Evaluation of literature by Coordinating Lead Authors

Description of evidence base

Trends in greenhouse gas emissions intensity are analyzed and published by governmental reporting agencies.23,24,25 Published, peer-reviewed literature cited in Section 2 of the Mitigation Chapter supports the conclusions about why these trends have occurred.26,27

New information and remaining uncertainties

Economic and technological forecasts are highly uncertain.

Assessment of confidence based on evidence

High. The statement is a summary restatement of published analyses by government agencies and interpretation from the reviewed literature.

Confidence Level

Very High

Strong evidence (established theory, multiple sources, consistent results, well documented and accepted methods, etc.), high consensus

High

Moderate evidence (several sources, some consistency, methods vary and/or documentation limited, etc.), medium consensus

Medium

Suggestive evidence (a few sources, limited consistency, models incomplete, methods emerging, etc.), competing schools of thought

Low

Inconclusive evidence (limited sources, extrapolations, inconsistent findings, poor documentation and/or methods not tested, etc.), disagreement or lack of opinions among experts

Key Message 4

Carbon storage in land ecosystems, especially forests, has offset around 17% of annual U.S. fossil fuel emissions of greenhouse gases over the past several decades, but this carbon “sink” may not be sustainable.

Supporting Evidence
close

Supporting Evidence

Process for Developing Key Messages:

Evaluation of literature by Coordinating Lead Authors

Description of evidence base

Underlying data come primarily from U.S. Forest Service Forest Inventory and Analysis (FIA) plots, supplemented by additional ecological data collection efforts. Modeling conclusions come from peer-reviewed literature. All references are in Section 2 of the Mitigation Chapter. Studies have shown that there is a large land-use carbon sink in the United States.25,28,29 Many publications attribute this sink to forest re-growth, and the sink is projected to decline as a result of forest aging30,31,32,33 and factors like drought, fire, and insect infestations31 reducing the carbon sink of these regions.

New information and remaining uncertainties

FIA plots are measured extremely carefully over long time periods, but do not cover all U.S. forested land. Other U.S. land types must have carbon content estimated from other sources. Modeling relationships between growth and carbon content, and taking CO2 and climate change into account have large scientific uncertainties associated with them.

Assessment of confidence based on evidence

High. Evidence of past trends is based primarily on government data sources, but these also have to be augmented by other data and models in order to incorporate additional land-use types. Projecting future carbon content is consistent with published models, but these have intrinsic uncertainties associated with them.

Confidence Level

Very High

Strong evidence (established theory, multiple sources, consistent results, well documented and accepted methods, etc.), high consensus

High

Moderate evidence (several sources, some consistency, methods vary and/or documentation limited, etc.), medium consensus

Medium

Suggestive evidence (a few sources, limited consistency, models incomplete, methods emerging, etc.), competing schools of thought

Low

Inconclusive evidence (limited sources, extrapolations, inconsistent findings, poor documentation and/or methods not tested, etc.), disagreement or lack of opinions among experts

Key Message 5

Both voluntary activities and a variety of policies and measures that lower emissions are currently in place at federal, state, and local levels in the United States, even though there is no comprehensive national climate legislation. Over the remainder of this century, aggressive and sustained greenhouse gas emission reductions by the United States and by other nations would be needed to reduce global emissions to a level consistent with the lower scenario (B1) analyzed in this assessment.

Supporting Evidence
close

Supporting Evidence

Process for Developing Key Messages:

Evaluation of literature by Coordinating Lead Authors

Description of evidence base

The identification of state, local, regional, federal, and voluntary programs that will have an effect of reducing greenhouse gas emissions is a straightforward accounting of both legislative action and announcements of the implementation of such programs. Some of the programs include the Carbon Disclosure Project (CDP), the American College and University Presidents' Climate Commitment (ACUPCC), U.S. Mayors Climate Protection Agreement,34 and many other local government initiatives.35,36 Several states have also adapted climate policies including California's Global Warming Solutions Act (AB 32) and the Regional Greenhouse Gas Initiative (RGGI). The assertion that they will not lead to a reduction of US CO2 emissions is supported by calculations from the U.S. Energy Information Administration.

New information and remaining uncertainties

The major uncertainty in the calculation about future emissions levels is whether a comprehensive national policy will be implemented.

Assessment of confidence based on evidence

Very High. There is recognition that the implementation of voluntary programs may differ from how they are originally planned, and that institutions can always choose to leave voluntary programs (as is happening with RGGI, noted in the chapter). The statement about the future of U.S. CO2 emissions cannot be taken as a prediction of what will happen – it is a conditional statement based on an assumption of no comprehensive national legislation or regulation.

Confidence Level

Very High

Strong evidence (established theory, multiple sources, consistent results, well documented and accepted methods, etc.), high consensus

High

Moderate evidence (several sources, some consistency, methods vary and/or documentation limited, etc.), medium consensus

Medium

Suggestive evidence (a few sources, limited consistency, models incomplete, methods emerging, etc.), competing schools of thought

Low

Inconclusive evidence (limited sources, extrapolations, inconsistent findings, poor documentation and/or methods not tested, etc.), disagreement or lack of opinions among experts

Section 1: U.S. Emissions and Land-Use Change

Industrial, Commercial, and Household Emissions

U.S. greenhouse gas emissions, not accounting for uptake by land use and agriculture (see Figure 27.3), rose to as high as 7,260 million tons CO2-e in 2007, and then fell by about 9% between 2008 and 2012.38 Several factors contributed to the decline, including the reduction in energy use in response to the 2008-2010 recession, the displacement of coal in electric generation by lower-priced natural gas, and the effect of federal and state energy and environmental policies.23

Carbon dioxide made up 84% of U.S. greenhouse gas emissions in 2011. Forty-one percent of these emissions were attributable to liquid fuels (petroleum), followed closely by solid fuels (principally coal in electric generation), and to a lesser extent by natural gas.23 The two dominant production sectors responsible for these emissions are electric power generation (coal and gas) and transportation (petroleum). Flaring and cement manufacture together account for less than 1% of the total. If emissions from electric generation are allocated to their various end-uses, transportation is the largest CO2 source, contributing a bit over one-third of the total, followed by industry at slightly over a quarter, and residential use and the commercial sector at around one-fifth each.

A useful picture of historical patterns of carbon dioxide emissions can be constructed by decomposing the cumulative change in emissions from a base year into the contributions of five driving forces: 1) decline in the CO2 content of energy use, as with a shift from coal to natural gas in electric generation, 2) reduction in energy intensity – the energy needed to produce each unit of gross domestic product (GDP) – which results from substitution responses to energy prices, changes in the composition of the capital stock, and both autonomous and price-induced technological change, 3) changes in the structure of the economy, such as a decline in energy-intensive industries and an increase in services that use less energy, 4) growth in per capita GDP, and 5) rising population.

Over the period 1963-2008, annual U.S. carbon dioxide emissions slightly more than doubled, because growth in emissions potential attributable to increases in population and GDP per person outweighed reductions contributed by lowered energy and carbon intensity and changes in economic structure (Figure 27.2). Each series in the figure illustrates the quantity of cumulative emissions since 1963 that would have been generated by the effect of the associated driver. By 2008, fossil fuel burning had increased CO2 emissions by 2.7 billion tons over 1963 levels. However, by itself the observed decline in energy would have reduced emissions by 1.8 billion tons, while the observed increase in per capita GDP would have increased emissions by more than 5 billion tons.

Figure 27.2: Drivers of U.S. Fossil Emissions

Drivers of U.S. Fossil Emissions

Co2 IntensityEnergy IntensityStructural ChangePer Capita IncomePopulationSum of Factors

Figure 27.2: This graph depicts the changes in carbon dioxide (CO2) emissions over time as a function of five driving forces: 1) the amount of CO2 produced per unit of energy (CO2 intensity); 2) the amount of energy used per unit of gross domestic product (energy intensity); 3) structural changes in the economy; 4) per capita income; and 5) population. Although CO2 intensity and especially energy intensity have decreased significantly and the structure of the U.S. economy has changed, total CO2 emissions have continued to rise as a result of the growth in both population and per capita income. (Baldwin and Sue Wing, 201337).

Details/Download

After decades of increases, CO2 emissions from energy use (which account for 97% of total U.S. emissions) declined by around 9% between 2008 and 2012, largely due to a shift from coal to less CO2-intensive natural gas for electricity production.38 Trends in driving forces shown in Figure 27.2 are expected to continue in the future, though their relative contributions are subject to significant uncertainty. The reference case projection by the U.S. Energy Information Administration (EIA) shows their net effect being a slower rate of CO2 emissions growth than in the past, with roughly constant energy sector emissions to 2040.39 It must be recognized, however, that emissions from energy use rise and fall from year to year, as the aforementioned driving forces vary.

The primary non-CO2 gas emissions in 2011 were methane (9% of total CO2-e emissions), nitrous oxide (5%), and a set of industrial gases (2%). U.S. emissions of each of these gases have been roughly constant over the past half-dozen years.39 Emissions of methane and nitrous oxide have been roughly constant over the past couple of decades, but there has been an increase in the industrial gases as some are substituted for ozone-destroying substances controlled by the Montreal Protocol.24

Yet another warming influence on the climate system is black carbon (soot), which consists of fine particles that result mainly from incomplete combustion of fossil fuels and biomass. Long a public health concern, black carbon particles absorb solar radiation during their short life in the atmosphere (days to weeks). When deposited on snow and ice, these particles darken the surface and reduce the reflection of incoming solar radiation back to space. These particles also influence cloud formation in ways yet poorly quantified.40

Land Use, Forestry, and Agriculture

The main stocks of carbon in its various biological forms (plants and trees, dead wood, litter, soil, and harvested products) are estimated periodically and their rate of change, or flux, is calculated as the average annual difference between two time periods. Estimates of carbon stocks and fluxes for U.S. lands are based on land inventories augmented with data from ecosystem studies and production reports.41,25

U.S. lands were estimated to be a net sink of between approximately 640 and 1,074 million tons CO2-e in the late 2000s.25,28 Estimates vary depending on choice of datasets, models, and methodologies (see Ch. 15: Biogeochemical Cycles, “Estimating the U.S. Carbon Sink,” for more discussion). This net land sink effect is the result of sources (from crop production, livestock production, and grasslands) and sinks (in forests, urban trees, and wetlands). Sources of carbon have been relatively stable over the last two decades, but sinks have been more variable. Long-term trends suggest significant emissions from forest clearing in the early 1900s followed by a sustained period of net uptake from forest regrowth over the last 70 years.29 The amount of carbon taken up by U.S. land sinks is dominated by forests, which have annually absorbed 7% to 24% (with a best estimate of about 16%) of fossil fuel CO2 emissions in the U.S. over the past two decades.23

Figure 27.3: Sources and Sinks in U.S. Agriculture and Forests Sources and Sinks in U.S. Agriculture and Forests Details/Download

The persistence of the land sink depends on the relative effects of several interacting factors: recovery from historical land-use change, atmospheric CO2 and nitrogen deposition, natural disturbances, and the effects of climate variability and change – particularly drought, wildfires, and changes in the length of the growing season. Deforestation continues to cause an annual loss of 877,000 acres (137,000 square miles) of forested land, offset by a larger area gain of new forest of about 1.71 million acres (268,000 square miles) annually.42 Since most of the new forest is on relatively low-productivity lands of the Intermountain West, and much of the deforestation occurs on high-productivity lands in the East, recent land-use changes have decreased the potential for future carbon storage.30 The positive effects of increasing carbon dioxide concentration and nitrogen deposition on carbon storage are not likely to be as large as the negative effects of land-use change and disturbances.31 In some regions, longer growing seasons associated with climate change may increase annual productivity.43 Droughts and other disturbances, such as fire and insect infestations, have already turned some U.S. land regions from carbon sinks into carbon sources (see Ch. 13: Land Use & Land Cover Change and Ch. 15: Biogeochemical Cycles).31 The current land sink may not be sustainable for more than a few more decades,32,33 though there is a lack of consistency in published results about the relative effects of disturbance and other factors on net land-use emissions.31,44,45

Section 2: Activities Affecting Emissions

Early and large reductions in global emissions would be necessary to achieve the lower emissions scenarios (such as the lower B1 scenario; see Ch. 2: Our Changing Climate) analyzed in this assessment. The principal types of national actions that could effect such changes include putting a price on emissions, setting regulations and standards for activities that cause emissions, changing subsidy programs, and direct federal expenditures. Market-based approaches include cap and trade programs that establish markets for trading emissions permits, analogous to the Clean Air Act provisions for sulfur dioxide reductions. None of these price-based measures has been implemented at the national level in the United States, though cap and trade systems are in place in California and in the Northeast’s Regional Greenhouse Gas Initiative. Moreover, a wide range of governmental actions are underway at federal, state, regional, and city levels using other measures, and voluntary efforts, that can reduce the U.S. contribution to total global emissions. Many, if not most of these programs are motivated by other policy objectives – energy, transportation, and air pollution – but some are directed specifically at greenhouse gas emissions, including:

  • reduction in CO2 emissions from energy end-use and infrastructure through the adoption of energy-efficient components and systems – including buildings, vehicles, manufacturing processes, appliances, and electric grid systems;
  • reduction of CO2 emissions from energy supply through the promotion of renewables (such as wind, solar, and bioenergy), nuclear energy, and coal and natural gas electric generation with carbon capture and storage; and
  • reduction of emissions of non-CO2 greenhouse gases and black carbon; for example, by lowering methane emissions from energy and waste, transitioning to climate-friendly alternatives to hydrofluorocarbons (HFCs), cutting methane and nitrous oxide emissions from agriculture, and improving combustion efficiency and means of particulate capture.

men installing solar panels; nuclear power plant; wind turbines at sunset; man assembling window; workers on automobile assembly line

Programs underway that reduce carbon dioxide emissions include the promotion of solar, nuclear, and wind power and efficient vehicles.

Federal Actions

The Federal Government has implemented a number of measures that promote energy efficiency, clean technologies, and alternative fuels.46,47,48,49,50 A sample of these actions is provided in Table 27.1 and they include greenhouse gas regulations, other rules and regulations with climate co-benefits, various standards and subsidies, research and development, and federal procurement practices.

The U.S. Environmental Protection Agency (EPA) has a 40-year history of regulating the concentration and deposition of criteria pollutants (six common air pollutants that affect human health). A 2012 Supreme Court decision upheld the EPA’s finding that greenhouse gases “endanger public health and welfare.”51 This ruling added the regulation of greenhouse gas emissions to the Agency’s authority under the Clean Air Act. Actions taken and proposed under the new authority have focused on road transport and electric power generation.

The U.S. Department of Energy (DOE) provides most of the funding for a broad range of programs for energy research, development, and demonstration. DOE also has the authority to regulate the efficiency of appliances and building codes for manufactured housing. In addition, most of the other federal agencies – including the Departments of Defense, Housing and Urban Development, Transportation, and Agriculture – have programs related to greenhouse gas mitigation.

wind turbines and solar panels ©Jerome Levitch/Corbis; Courtesy of DOE

The Administration’s Climate Action Plan52 supplements these activities with a broad range of mitigation, adaptation, and preparedness measures. The mitigation elements of the plan are in part a response to the commitment made during the 2010 Cancun Conference of the Parties of the United Nations Framework Convention on Climate Change to reduce U.S. emissions of greenhouse gases by 17% below 2005 levels by 2020. Actions proposed in the Plan include: 1) limiting carbon emissions from both new and existing power plants, 2) continuing to increase the stringency of fuel economy standards for automobiles and trucks, 3) continuing to improve energy efficiency in the buildings sector, 4) reducing the emissions of non-CO2 greenhouse gases through a variety of measures, 5) increasing federal investments in cleaner, more efficient energy sources for both power and transportation, and 6) identifying new approaches to protect and restore our forests and other critical landscapes, in the presence of a changing climate.

City, State, and Regional Actions

Jurisdiction for greenhouse gases and energy policies is shared between the federal government and the states.53 For example, states regulate the distribution of electricity and natural gas to consumers, while the Federal Energy Regulatory Commission regulates wholesale sales and transportation of natural gas and electricity. In addition, many states have adopted climate initiatives as well as energy policies that reduce greenhouse gas emissions. For a survey of many of these state activities, see Table 27.2. Many cities are taking similar actions.

The most ambitious state activity is California’s Global Warming Solutions Act (AB 32), a law that sets a state goal to reduce greenhouse gas emissions to 1990 levels by 2020. The state program caps emissions and uses a market-based system of trading in emissions credits (cap and trade), as well as a number of regulatory actions. The most well-known, multi-state effort has been the Regional Greenhouse Gas Initiative (RGGI), formed by ten northeastern and Mid-Atlantic states (though New Jersey exited in 2011). RGGI is a cap and trade system applied to the power sector with revenue from allowance auctions directed to investments in efficiency and renewable energy.

Voluntary Actions

Corporations, individuals, and non-profit organizations have initiated a host of voluntary actions. The following examples give the flavor of the range of efforts:

  • The Carbon Disclosure Project has the largest global collection of self-reported climate change and water-use information. The system enables companies to measure, disclose, manage, and share climate change and water-use information. Some 650 U.S. signatories include banks, pension funds, asset managers, insurance companies, and foundations.
  • Many local governments are undertaking initiatives to reduce greenhouse gas emissions within and outside of their organizational boundaries.35,36 For example, over 1,055 municipalities from all 50 states have signed the U.S. Mayors Climate Protection Agreement,34 and many of these communities are actively implementing strategies to reduce their greenhouse gas footprint.
  • Under the American College and University Presidents’ Climate Commitment (ACUPCC), 679 institutions have pledged to develop plans to achieve net-neutral climate emissions through a combination of on-campus changes and purchases of emissions reductions elsewhere.
  • Voluntary compliance with efficiency standards developed by industry and professional associations, such as the building codes of the American Society of Heating, Refrigerating and Air-Conditioning Engineers (ASHRAE), is widespread.
  • Federal voluntary programs include Energy STAR, a labeling program that identifies energy efficient products for use in residential homes and commercial buildings and plants, and programs and partnerships devoted to reducing methane emissions from fossil fuel production and landfill sources and high GWP emissions from industrial activities and agricultural conservation programs.
scientists; electric bus; green roofs ©Denise Applewise; ©Najlah Feanny/Corbis; ©Proehl Studios/Corbis

Costs of Emissions Reductions

The national cost of achieving U.S. emissions reductions over time depends on the level of reduction sought and the particular measures employed. Studies of price-based policies, such as a cap and trade system, indicate that a 50% reduction in emissions by 2050 could be achieved at a cost of a year or two of projected growth in gross domestic product over the period (for example, Paltsev et al. 2009; EIA 200954,55). However, because of differences in analysis method, and in assumptions about economic growth and technology change, cost projections vary considerably even for a policy applying price penalties.56 Comparisons of emissions reduction by prices versus regulations show that a regulatory approach can cost substantially more than a price-based policy.57,58

Co-Benefits for Air Pollution and Human Health

smog over city ©iStockPhoto.com/Daniel Stein

Actions to reduce greenhouse gas emissions can yield co-benefits for objectives apart from climate change, such as energy security, health, ecosystem services, and biodiversity.59,60 The co-benefits for reductions in air pollution have received particular attention. Because air pollutants and greenhouse gases share common sources, particularly from fossil fuel combustion, actions to reduce greenhouse gas emissions also reduce air pollutants. While some greenhouse gas reduction measures might increase other emissions, broad programs to reduce greenhouse gases across an economy or a sector can reduce air pollutants markedly.13,61 (Unfortunately for climate mitigation, cutting sulfur dioxide pollution from coal burning also reduces the cooling influence of reflective particles formed from these emissions in the atmosphere.62)

There is significant interest in quantifying the air pollution and human health co-benefits of greenhouse gas mitigation, particularly from the public health community,60,63 as the human health benefits can be immediate and local, in contrast to the long-term and widespread effects of climate change.64 Many studies have found that monetized health and pollution control benefits can be of similar magnitude to abatement costs (for example, Nemet et al. 2010; Burtraw et al. 200364,65). Methane reductions have also been shown to generate health benefits from reduced ozone.66 Similarly, in developing nations, reducing black carbon from household cook stoves substantially reduces air pollution-related illness and death.67,68,69 Ancillary health benefits in developing countries typically exceed those in developed countries for a variety of reasons.64 But only in very few cases are these ancillary benefits considered in analyses of climate mitigation policies.

Section 3: Preparation for Potential Future Mitigation Action

To meet the emissions reduction in the lower (B1) scenario used in this assessment (Ch. 2: Our Changing Climate) under reasonable assumptions about managing costs, annual global CO2 emissions would need to peak at around 44 billion tons within the next 25 years or so and decline steadily for the rest of the century. At the current rate of emissions growth, the world is on a path to exceed the 44 billion ton level within a decade (see “Emissions Scenarios and RCPs”). Thus achievement of a global emissions path consistent with the B1 scenario will require strenuous action by all major emitters.

Policies already enacted and other factors lowered U.S. emissions in recent years. The Annual Energy Outlook prepared by the EIA, which previously forecasted sustained growth in emissions, projected in 2013 that energy-related U.S. CO2 emissions would remain roughly constant for the next 25 years.39 Moreover, through the President’s Climate Action Plan, the Administration has committed to additional measures not yet reflected in the EIA’s projections, with the goal of reducing emissions about 17% below 2005 levels by 2020. Still, additional and stronger U.S. action, as well as strong action by other major emitters, will be needed to meet the long-term global emission reductions reflected in the B1 scenario.

Achieving the B1 emissions path would require substantial decarbonization of the global economy by the end of this century, implying a fundamental transformation of the global energy system. Details of the energy mix along the way differ among analyses, but the implied involvement by the U.S. can be seen in studies carried out under the U.S. Climate Change Science Program20 and the Energy Modeling Forum.70,71,72,73 In these studies, direct burning of coal without carbon capture is essentially excluded from the power system, and the same holds for natural gas toward the end of the century – to be replaced by some combination of coal or gas with carbon capture and storage, nuclear generation, and renewables. Biofuels and electricity are projected to substitute for oil in the transport sector. A substantial component of the task is accomplished with demand reduction, through efficiency improvement, conservation, and shifting to an economy less dependent on energy services.

Emissions Scenarios and RCPs

The Representative Concentration Pathways (RCPs) specify alternative limits to human influence on the Earth’s energy balance, stated in watts per square meter (W/m2) of the Earth’s surface.12,74 The A2 emissions scenario implies atmospheric concentrations with radiative forcing slightly lower than the highest RCP, which is 8.5 W/m2. The lower limits, at 6.0, 4.5 and 2.6 W/m2, imply ever-greater mitigation efforts. The B1 scenario (rapid emissions reduction) is close to the 4.5 W/m2 RCP19 and to a similar case (Level 2) analyzed in a previous federal study.20 Those assessments find that, to limit the economic costs, annual global CO2 emissions from fossil fuels and industrial sources like cement manufacture, need to peak by 2035 to 2040 at around 44 billion tons of CO2, and decline thereafter. The scale of the task can be seen in the fact that these global emissions were already at 34 billion tons CO2 in 2011, and over the previous decade they rose at around 0.92 billion tons of CO2 per year.1,2 The lowest RCP would require an even more rapid turnaround and negative net emissions – that is, removing more CO2 from the air than is emitted globally – in this century.74

The challenge is great enough even starting today, but delay by any of the major emitters makes meeting any such target even more difficult and may rule out some of the more ambitious goals.20,70 A study of the climate change threat and potential responses by the U.S. National Academies therefore concludes that there is “an urgent need for U.S. action to reduce greenhouse emissions.”75 The National Research Council (NRC) goes on to suggest alternative national-level strategies that might be followed, including an economy-wide system of prices on greenhouse gas emissions and a portfolio of possible regulatory measures and subsidies. Deciding these matters will be a continuing task, and U.S. Administrations and Congress face a long series of choices about whether to take additional mitigation actions and how best to do it. Two supporting activities will help guide this process: opening future technological options and development of ever-more-useful assessments of the cost effectiveness and benefits of policy choices.

Many technologies are potentially available to accomplish emissions reduction. They include ways to increase the efficiency of fossil energy use and facilitate a shift to low-carbon energy sources, sources of improvement in the cost and performance of renewables (for example, wind, solar, and bioenergy) and nuclear energy, ways to reduce the cost of carbon capture and storage, means to expand terrestrial sinks through management of forests and soils and increased agricultural productivity,76 and phasing down HFCs. In addition to the research and development carried out by private sector firms with their own funds, the Federal Government traditionally supports major programs to advance these technologies. This support is accomplished in part by credits and deductions in the tax code, and in part by federal expenditure. For example, the 2012 federal budget devoted approximately $6 billion to clean energy technologies.77 Success in these ventures, lowering the cost of greenhouse gas reduction, can make a crucial contribution to future policy choices.53

Because they are in various stages of market maturity, the costs and effectiveness of many of these technologies remain uncertain: continuing study of their performance is important to understanding their role in future mitigation decisions.78,79 In addition, evaluation of broad policies and particular mitigation measures requires frameworks that combine information from a range of disciplines. Study of mitigation in the near future can be done with energy-economic models that do not assume large changes in the mix of technologies or changes in the structure of the economy. Analysis over the time spans relevant to stabilization of greenhouse gas concentrations, however, requires Integrated Assessment Models, which consider all emissions drivers and policy measures that affect them, and that take account of how they are related to the larger economy and features of the climate system.20,70,80,81,82 This type of analysis is also useful for exploring the relations between mitigation and measures to adapt to a changing climate.

Interactions Between Adaptation and Mitigation

There are various ways in which mitigation efforts and adaptation measures are interdependent (see Ch. 28: Adaptation). For example, the use of plant material as a substitute for petroleum-based transportation fuels or directly as a substitute for burning coal or gas for electricity generation has received substantial attention.83 But land used for mitigation purposes is potentially not available for food production, even as the global demand for agricultural products continues to rise.84,85,86 Conversely, land required for adaptation strategies, like setting aside wildlife corridors or expanding the extent of conservation areas, is potentially not available for mitigation involving the use of plant material, or active management practices to enhance carbon storage in vegetation or soils. These possible interactions are poorly understood but potentially important, especially as climate change itself affects vegetation and ecosystem productivity and carbon storage. Increasing agricultural productivity to adapt to climate change can also serve to mitigate climate change.

Continued development of these analytical capabilities can help support decisions about national mitigation and the U.S. position in international negotiations. In addition, as shown above, mitigation is being undertaken by individuals and firms as well as by city, state, and regional governments. The capacity for mitigation from individual and household behavioral changes, such as increasing energy end-use efficiency with available technology, is known to be large.87 Although there is capacity, there is not always broad acceptance of those behavioral changes, nor is there sufficient understanding of how to design programs to encourage such changes.88 Behavioral and institutional research on how such choices are made and the results evaluated would be extremely beneficial. For many of these efforts, understanding of cost and effectiveness is limited, as is understanding of aspects of public support and institutional performance; so additional support for studies of these activities is needed to ensure that resources are efficiently employed.

Section 4: Research Needs

  • Engineering and scientific research is needed on the development of cost-effective energy use technologies (devices, systems, and control strategies) and energy supply technologies that produce little or no CO2 or other greenhouse gases.
  • Better understanding of the relationship between emissions and atmospheric greenhouse gas concentrations is needed to more accurately predict how the atmosphere and climate system will respond to mitigation measures.
  • processes controlling the land sink of carbon in the U.S. require additional research, including better monitoring and analysis of economic decision-making about the fate of land and how it is managed, as well as the inherent ecological processes and how they respond to the climate system.
  • Uncertainties in model-based projections of greenhouse gas emissions and of the effectiveness and costs of policy measures need to be better quantified. Exploration is needed of the effects of different model structures, assumptions about model parameter values, and uncertainties in input data.
  • Social and behavioral science research is needed to inform the design of mitigation measures for maximum participation and to prepare a consistent framework for assessing cost effectiveness and benefits of both voluntary mitigation efforts and regulatory and subsidy programs.

Table 27.1: Sample Federal Mitigation Measures

close
Greenhouse Gas Regulations
Emissions Standards for Vehicles and Engines

-- For light-duty vehicles, rules establishing standards for 2012-2016 model years and 2017-2025 model years.

-- For heavy- and medium-duty trucks, a rule establishing standards for 2014-2018 model years.

Carbon Pollution Standard for New Power Plants

-- A proposed rule setting limits on CO2 emissions from future power plants.

Stationary Source Permitting

-- A rule setting greenhouse gas emissions thresholds to define when permits under the New Source Review Prevention of Significant Deterioration and Title V Operating Permit programs are required for new and modified industrial facilities.

Greenhouse Gas Reporting Program

-- A program requiring annual reporting of greenhouse gas data from large emission sources and suppliers of products that emit greenhouse gases when released or combusted.

Other Rules and Regulations with Climate Co-Benefits
Oil and Natural Gas Air Pollution Standards

-- A rule revising New Source Performance Standards and National Emission Standards for Hazardous Air Pollutants for certain components of the oil and natural gas industry.

Mobile Source Control Programs

-- Particle control regulations affecting mobile sources (especially diesel engines) that reduce black carbon by controlling direct particle emissions.

-- The requirement to blend increasing volumes of renewable fuels.

National Forest Planning

-- Identification and evaluation of information relevant to a baseline assessment of carbon stocks.

-- Reporting of net carbon stock changes on forestland.

Standards and Subsidies
Appliance and Building Efficiency Standards

-- Energy efficiency standards and test procedures for residential, commercial, industrial, lighting, and plumbing products.

-- Model residential and commercial building energy codes, and technical assistance to state and local governments, and non-governmental organizations.

Financial Incentives for Efficiency and Alternative Fuels and Technology

-- Weatherization assistance for low-income households, tax incentives for commercial and residential buildings and efficient appliances, and support for state and local efficiency programs.

-- Tax credits for biodiesel and advanced biofuel production, alternative fuel infrastructure, and purchase of electric vehicles

-- Loan guarantees for innovative energy or advanced technology vehicle production and manufacturing; investment and production tax credits for renewable energy.

Funding of Research, Development, Demonstration, and Deployment
-- Programs on clean fuels, energy end-use and infrastructure, CO2 capture and storage, and agricultural practices.
Federal Agency Practices and Procurement

-- Executive orders and federal statutes requiring federal agencies to reduce building energy and resource consumption intensity and to procure alternative fuel vehicles.

-- Agency-initiated programs in most departments oriented to lowering energy use and greenhouse gas emissions.

Table 27.1: A number of existing federal laws and regulations target ways to reduce future climate change by decreasing greenhouse gas emissions emitted by human activities.

Table 27.2: State Climate and Energy Initiatives

close

STATE CLIMATE AND ENERGY INITIATIVES

Most states and native communities have implemented programs to reduce greenhouse gases or adopt increased energy efficiency goals. Examples of greenhouse gas policies include:

Also, states have taken a number of energy measures, motivated in part by greenhouse gas concerns. For example:

References

  1. ,, 2011: Direct Air Capture of CO2 with Chemicals: A Technology Assessment for the APS Panel on Public Affairs. 100 pp., American Physical Society. URL | Detail

  2. Archer, D., 2010: The Global Carbon Cycle. Princeton University Press, 205 pp. | Detail

  3. Baldwin, J. G., and I. Sue Wing, 2013: The spatiotemporal evolution of U.S. carbon dioxide emissions: Stylized facts and implications for climate policy. Journal of Regional Science, in press, doi:10.1111/jors.12028. | Detail

  4. Bell, M., D. Davis, L. Cifuentes, A. Krupnick, R. Morgenstern, and G. Thurston, 2008: Ancillary human health benefits of improved air quality resulting from climate change mitigation. Environmental Health, 7, 1-18, doi:10.1186/1476-069x-7-41. | Detail

  5. Birdsey, R., K. Pregitzer, and A. Lucier, 2006: Forest carbon management in the United States: 1600–2100. Journal of Environmental Quality, 35, 1461–1469, doi:10.2134/jeq2005.0162. | Detail

  6. Burtraw, D., A. Krupnick, K. Palmer, A. Paul, M. Toman, and C. Bloyd, 2003: Ancillary benefits of reduced air pollution in the US from moderate greenhouse gas mitigation policies in the electricity sector. Journal of Environmental Economics and Management, 45, 650-673, doi:10.1016/S0095-0696(02)00022-0. | Detail

  7. ,, 2013: Greenhouse Gas Emissions Targets. Center for Climate and Energy Solutions. URL | Detail

  8. ,, 2013: Climate Action Plans. Center for Climate and Energy Solutions. URL | Detail

  9. ,, 2013: Greenhouse Gas Reporting and Registries. Center for Climate and Energy Solutions. URL | Detail

  10. ,, 2013: Low Carbon Fuel Standard. Center for Climate and Energy Solutions. URL | Detail

  11. ,, 2013: Multi-State Climate Initiatives. Center for Climate and Energy Solutions. URL | Detail

  12. Caspersen, J. P., S. W. Pacala, J. C. Jenkins, G. C. Hurtt, P. R. Moorcroft, and R. A. Birdsey, 2000: Contributions of land-use history to carbon accumulation in U.S. forests. Science, 290, 1148-1151, doi:10.1126/science.290.5494.1148. | Detail

  13. ,, 2009: The Costs of Reducing Greenhouse-Gas Emissions. 12 pp., Congressional Budget Office, Washington, D.C. URL | Detail

  14. ,, 2009: Strategies of the Commercialization and Deployment of Greenhouse Gas Intensity-Reducing Technologies and Practices. DOE/PI-000. 190 pp., The Committee on Climate Change Science and Technology Integration. URL | Detail

  15. ,, 2013: Cap-and-Trade Program. California Environmental Protection Agency. URL | Detail

  16. Charlson, R. J., and T. M. L. Wigley, 1994: Sulfate aerosol and climatic change. Scientific American. | Detail

  17. Cicerone, R. J., and R. S. Oremland, 1988: Biogeochemical aspects of atmospheric methane. Global Biogeochemical Cycles, 2, 299-327, doi:10.1029/GB002i004p00299. | Detail

  18. Clarke, L., J. Edmonds, H. Jacoby, H. Pitcher, J. Reilly, and R. Richels, 2007: Scenarios of Greenhouse Gas Emissions and Atmospheric Concentrations–US Climate Change Science Program Synthesis and Assessment Product 2.1a. Sub-report 2.1A of Synthesis and Assessment Product 2.1. 154 pp., U.S. Department of Energy, Office of Biological & Environmental Research, Washington, D.C. URL | Detail

  19. Clarke, L., J. Edmonds, V. Krey, R. Richels, S. Rose, and M. Tavoni, 2009: International climate policy architectures: Overview of the EMF 22 International Scenarios. Energy Economics, 31, S64-S81, doi:10.1016/j.eneco.2009.10.013. | Detail

  20. Clarke, L., A. Fawcett, J. McFarland, J. Weyant, Y. Zhou, and V. Chaturvedi, 2013: Technology and US emissions reductions goals: Results of the EMF 24 modeling exercise. The Energy Journal, In press. | Detail

  21. Davis, D. L., 1997: Short-term improvements in public health from global-climate policies on fossil-fuel combustion: An interim report. The Lancet, 350, 1341-1349, doi:10.1016/S0140-6736(97)10209-4. | Detail

  22. DeFries, R., and C. Rosenzweig, 2010: Toward a whole-landscape approach for sustainable land use in the tropics. Proceedings of the National Academy of Sciences, 107, 19627-19632, doi:10.1073/pnas.1011163107. URL | Detail

  23. Denman, K. L., G. Brasseur, A. Chidthaisong, P. Ciais, P. M. Cox, R. E. Dickinson, D. Hauglustaine, C. Heinze, E. Holland, D. Jacob, U. Lohmann, S. Ramachandran, P. Lda Silva Dias, S. C. Wofsy, and X. Zhang, 2007: Ch. 7: Couplings between changes in the climate system and biogeochemistry. Climate Change 2007: The Physical Science Basis. Contribution of Working Group I to the Fourth Assessment Report of the Intergovernmental Panel on Climate Change, S. Solomon, Qin, D., Manning, M., Chen, Z., Marquis, M., Averyt, K.B., Tignor, M., and Miller, H.L., Eds., Cambridge University Press, 499-587. URL | Detail

  24. Dietz, T., G. T. Gardner, J. Gilligan, P. C. Stern, and M. P. Vandenbergh, 2009: Household actions can provide a behavioral wedge to rapidly reduce US carbon emissions. Proceedings of the National Academy of Sciences, 106, 18452-18456, doi:10.1073/pnas.0908738106. URL | Detail

  25. ,, 2009: The National Energy Modeling System: An Overview 2009. 83 pp., Energy Information Administration, Office of Integrated Analysis and Forecasting, Washington, D.C. URL | Detail

  26. ,, 2011: Report of the First Quadrennial Technology Review. 168 pp., U.S. Department of Energy, Washington, D.C. URL | Detail

  27. ,, 2013: Database of State Incentives for Renewables & Efficiency. Energy Efficiency Resource Standards. 1 pp., U.S. Department of Energy. URL | Detail

  28. ,, 2013: Database of State Incentives for Renewables & Efficiency. Property Tax Incentives for Renewables. 1 pp., U.S. Department of Energy. URL | Detail

  29. ,, 2013: Database of State Incentives for Renewables & Efficiency. Renewable Portfolio Standard Policies. 1 pp., U.S. Department of Energy. URL | Detail

  30. ,, 2012: States Have Led the Way in Curbing Carbon Pollution from New Power Plants. 1 pp., Environmental Defense Fund. URL | Detail

  31. Edmonds, J. A., T. Wilson, R. Rosenzweig, R. Benedick, E. L. Malone, J. F. Clarke, J. J. Dooley, and S. H. Kim, 2000: Global Energy Technology Strategy: Addressing Climate Change. Initial Findings from an International Public-Private Collaboration. The Global Energy Technology Strategy Program, Washington, D.C. URL | Detail

  32. Edmonds, J. A., M. A. Wise, J. J. Dooley, S. H. Kim, S. J. Smith, P. J. Runci, L. E. Clarke, E. L. Malone, and G. M. Stokes, 2007: Global Energy Technology Strategy: Addressing Climate Change. Phase 2 Findings from an International Public-Private Sponsored Research Program. The Global Energy Technology Strategy Program, Washington, D.C. URL | Detail

  33. ,, 2009: Energy Market and Economic Impacts of H.R. 2454, the American Clean Energy and Security Act of 2009. 82 pp., U.S. Energy Information Administration, Washington, D.C. URL | Detail

  34. ,, 2011: International Energy Outlook 2011. U.S. Energy Information Administration, Washington, D.C. URL | Detail

  35. ,, 2012: Annual Energy Outlook 2012 with Projections to 2035. DOE/EIA-0383(2012). 239 pp., U.S. Energy Information Administration, Washington, D.C. URL | Detail

  36. ,, 2013: June 2013 Monthly Energy Review. DOE/EIA-0035(2013/06). 201 pp., U.S. Department of Energy, U.S. Energy Information Administration, Washington, D.C. URL | Detail

  37. ,, 2013: Annual Energy Outlook 2013 with Projections to 2040. DOE/EIA-0383(2013). 244 pp., U.S. Energy Information Administration, Washington, D.C. URL | Detail

  38. ,, 2010: Inventory of US Greenhouse Gas Emissions and Sinks: 1990-2008. 407 pp., U.S. Environmental Protection Agency, Washington, D.C. URL | Detail

  39. ,, 2012: Report to Congress on Black Carbon. EPA-450/R-12-001. 388 pp., U.S. Environmental Protection Agency, Washington, D.C. URL | Detail

  40. ,, 2013: Inventory of US Greenhouse Gas Emissions and Sinks: 1990-2011. U.S. Environmental Protection Agency, Washington, D.C. URL | Detail

  41. ,, 2013: Tribal Climate and Energy Information. U.S. Environmental Protection Agency. URL | Detail

  42. Fawcett, A., L. Clarke, S. Rausch, and J. Weyant, 2013: Overview of EMF 24 policy scenarios. The Energy Journal, In press. | Detail

  43. Fawcett, A. A., K. V. Calvin, F. C. de la Chesnaye, J. M. Reilly, and J. P. Weyant, 2009: Overview of EMF 22 U.S. transition scenarios. Energy Economics, 31, Supplement 2, S198-S211, doi:10.1016/j.eneco.2009.10.015. | Detail

  44. Fischer, C., and R. G. Newell, 2008: Environmental and technology policies for climate mitigation. Journal of Environmental Economics and Management, 55, 142-162, doi:10.1016/j.jeem.2007.11.001. | Detail

  45. ,, 2011: Climate Change: Improvements Needed to Clarify National Priorities and Better Align Them with Federal Funding Decisions. GAO-11-317. 95 pp., U.S. Government Accountability Office. URL | Detail

  46. ,, 2012: Carbon Budget 2012: An Annual Update of the Global Carbon Budget and Trends. Global Carbon Project. URL | Detail

  47. ,, 2010: Ten Years of Advancing Knowledge on the Global Carbon Cycle and its Management. Global Carbon Project, Tsukuba, Japan. URL | Detail

  48. Grieshop, A. P., C. C. O. Reynolds, M. Kandlikar, and H. Dowlatabadi, 2009: A black-carbon mitigation wedge. Nature Geoscience, 2, 533-534, doi:10.1038/ngeo595. | Detail

  49. Haines, A., K. R. Smith, D. Anderson, P. R. Epstein, A. J. McMichael, I. Roberts, P. Wilkinson, J. Woodcock, and J. Woods, 2007: Policies for accelerating access to clean energy, improving health, advancing development, and mitigating climate change. The Lancet, 370, 1264-1281, doi:10.1016/S0140-6736(07)61257-4. | Detail

  50. ,, 1995: The Science of Climate Change. Contribution of Working Group I to the Second Assessment Report of the Intergovernmental Panel on Climate Change. Summary for Policymakers and Technical Summary. J.A. Lakeman, Ed. Cambridge University Press. | Detail

  51. ,, 2007: Climate Change 2007: The Physical Science Basis. Contribution of Working Group I to the Fourth Assessment Report of the Intergovernmental Panel on Climate Change. Cambridge University Press, 996 pp. URL | Detail

  52. Janetos, A., and A. Wagener, 2002: Understanding the Ancillary Effects of Climate Change Policies: A Research Agenda. World Resources Institute Policy Brief, Washington, D.C. URL | Detail

  53. Janetos, A. C., L. Clarke, B. Collins, K. Ebi, J. Edmonds, I. Foster, J. Jacoby, K. Judd, R. Leung, and R. Newell, 2009: Science Challenges and Future Directions: Climate Change Integrated Assessment Research. Report PNNL-18417. 80 pp., U.S. Department of Energy, Office of Science. URL | Detail

  54. Karplus, V. J., S. Paltsev, M. Babiker, and J. M. Reilly, 2013: Should a vehicle fuel economy standard be combined with an economy-wide greenhouse gas emissions constraint? Implications for energy and climate policy in the United States. Energy Economics, 36, 322-333, doi:10.1016/j.eneco.2012.09.001. | Detail

  55. Krause, R. M., 2011: Symbolic or substantive policy? Measuring the extent of local commitment to climate protection. Environment and Planning C: Government and Policy, 29, 46-62, doi:10.1068/c09185. | Detail

  56. Masek, J. G., W. B. Cohen, D. Leckie, M. A. Wulder, R. Vargas, B. de Jong, S. Healey, B. Law, R. Birdsey, R. A. Houghton, D. Mildrexler, S. Goward, and W. B. Smit, 2011: Recent rates of forest harvest and conversion in North America. Journal of Geophysical Research, 116, G00K03, doi:10.1029/2010JG001471. URL | Detail

  57. ,, 2007: 549 U.S. 497.. URL | Detail

  58. Melillo, J. M., J. M. Reilly, D. W. Kicklighter, A. C. Gurgel, T. W. Cronin, S. Paltsev, B. S. Felzer, X. Wang, A. P. Sokolov, and C. A. Schlosser, 2009: Indirect emissions from biofuels: How important? Science, 326, 1397-1399, doi:10.1126/science.1180251. URL | Detail

  59. Metcalf, G. E., 2008: An empirical analysis of energy intensity and its determinants at the state level. The Energy Journal, 29, 1-26, doi:10.5547/ISSN0195-6574-EJ-Vol29-No3-1. URL | Detail

  60. Moore, III, B., and B. H. Braswell, 1994: The lifetime of excess atmospheric carbon dioxide. Global Biogeochemical Cycles, 8, 23-38, doi:10.1029/93GB03392. | Detail

  61. Moss, R. H., J. A. Edmonds, K. A. Hibbard, M. R. Manning, S. K. Rose, D. P. van Vuuren, T. R. Carter, S. Emori, M. Kainuma, T. Kram, G. A. Meehl, J. F. B. Mitchell, N. Nakicenovic, K. Riahi, S. J. Smith, R. J. Stouffer, A. M. Thomson, J. P. Weyant, and T. J. Wilbanks, 2010: The next generation of scenarios for climate change research and assessment. Nature, 463, 747-756, doi:10.1038/nature08823. | Detail

  62. Nemet, G. F., T. Holloway, and P. Meier, 2010: Implications of incorporating air-quality co-benefits into climate change policymaking. Environmental Research Letters, 5, 014007, doi:10.1088/1748-9326/5/1/014007. URL | Detail

  63. ,, 2010: Adapting to Impacts of Climate Change. America’s Climate Choices: Report of the Panel on Adapting to the Impacts of Climate Change. National Research Council. The National Academies Press, 292 pp. URL | Detail

  64. ,, 2010: Limiting the Magnitude of Future Climate Change. America’s Climate Choices. Panel on Limiting the Magnitude of Future Climate Change. National Research Council, Board on Atmospheric Sciences and Climate, Division of Earth and Life Studies. The National Academies Press, 276 pp. URL | Detail

  65. ,, 2011: Climate Stabilization Targets: Emissions, Concentrations, and Impacts over Decades to Millennia. National Research Council. The National Academies Press, 298 pp. URL | Detail

  66. ,, 2012: Fiscal Year 2013 Budget of the U.S. Government. 256 pp., Office of Management and Budget, Washington, D.C. URL | Detail

  67. Pacala, S., R. A. Birdsey, S. D. Bridgham, R. T. Conant, K. Davis, B. Hales, R. A. Houghton, J. C. Jenkins, M. Johnston, G. Marland, and K. Paustian, 2007: Ch. 3: The North American carbon budget past and present. The First State of the Carbon Cycle Report (SOCCR): The North American Carbon Budget and Implications for the Global Carbon Cycle, A.W. King, Dillling, L., Zimmerman, G.P., Fairman, D.M., Houghton, R.A., Marland, G., Rose, A.Z., and Wilbanks, T.J., Eds., 29-170. URL | Detail

  68. Paltsev, S., J. M. Reilly, H. D. Jacoby, and J. F. Morris, 2009: The cost of climate policy in the United States. Energy Economics, 31, S235-S243, doi:10.1016/j.eneco.2009.06.005. | Detail

  69. Pan, Y., R. Birdsey, J. Hom, and K. McCullough, 2009: Separating effects of changes in atmospheric composition, climate and land-use on carbon sequestration of US Mid-Atlantic temperate forests. Forest Ecology and Management, 259, 151-164, doi:10.1016/j.foreco.2009.09.049. URL | Detail

  70. Pan, Y., J. M. Chen, R. Birdsey, K. McCullough, L. He, and F. Deng, 2011: Age structure and disturbance legacy of North American forests. Biogeosciences, 8, 715–732, doi:10.5194/bg-8-715-2011. URL | Detail

  71. Parson, E. A., and D. W. Keith, 2013: End the deadlock on governance of geoengineering research. Science, 339, 1278-1279, doi:10.1126/science.1232527. | Detail

  72. Pitt, D. R., 2010: Harnessing community energy: The keys to climate mitigation policy adoption in US municipalities. Local Environment, 15, 717-729, doi:10.1080/13549839.2010.509388. | Detail

  73. Plattner, G. K. et al., 2008: Long-term climate commitments projected with climate-carbon cycle models. Journal of Climate, 21, 2721-2751, doi:10.1175/2007jcli1905.1. URL | Detail

  74. Prinn, R. G., 2013: Development and application of earth system models. Proceedings of the National Academy of Sciences, 110, 3673-3680, doi:10.1073/pnas.1107470109. URL | Detail

  75. Ramanathan, V., H. Rodhe, M. Agrawal, H. Akimoto, M. Auffhammer, U. K. Chopra, L. Emberson, S. Iqbal Hasnain, M. Iyngararasan, A. Jayaraman, M. Lawrence, T. Nakajima, M. Ruchirawat, A. K. Singh, J. R. Vincent, and Y. Zhang, 2008: Atmospheric Brown Clouds: Regional Assessment Report with Focus on Asia. 367 pp., United Nations Environment Programme, Nairobi, Kenya. | Detail

  76. Richardson, A. D. et al., 2010: Influence of spring and autumn phenological transitions on forest ecosystem productivity. Philosophical Transactions of the Royal Society B: Biological Sciences, 365, 3227-3246, doi:10.1098/rstb.2010.0102. URL | Detail

  77. Russell, L. M., P. J. Rasch, G. M. Mace, R. B. Jackson, J. Shepherd, P. Liss, M. Leinen, D. Schimel, N. E. Vaughan, A. C. Janetos, P. W. Boyd, R. J. Norby, K. Caldeira, J. Merikanto, P. Artaxo, J. Melillo, and M. G. Morgan, 2012: Ecosystem impacts of geoengineering: A review for developing a science plan. AMBIO: A Journal of the Human Environment, 41, 350-369, doi:10.1007/s13280-012-0258-5. URL | Detail

  78. Schimel, D. S., 1995: Terrestrial ecosystems and the carbon cycle. Global Change Biology, 1, 77-91, doi:10.1111/j.1365-2486.1995.tb00008.x. | Detail

  79. Shepherd, J. G., 2009: Geoengineering the Climate: Science, Governance and Uncertainty. Royal Society, 82 pp. URL | Detail

  80. Shindell, D. et al., 2012: Simultaneously mitigating near-term climate change and improving human health and food security. Science, 335, 183-189, doi:10.1126/science.1210026. | Detail

  81. I. Wing, S., 2008: Explaining the declining energy intensity of the US economy. Resource and Energy Economics, 30, 21-49, doi:10.1016/j.reseneeco.2007.03.001. | Detail

  82. ,, 2010: Economic Report of the President, Council of Economic Advisors. 462 pp., The White House, Washington, D.C. URL | Detail

  83. ,, 2010: Federal Climate Change Expenditures: Report to Congress. 34 pp., Office of Management and Budget, Washington, D.C. | Detail

  84. ,, 2012: A Secure Energy Future: Progress Report. The White House. URL | Detail

  85. ,, 2013: The President’s Climate Action Plan. The White House. URL | Detail

  86. Thomson, A. M., K. V. Calvin, L. P. Chini, G. Hurtt, J. A. Edmonds, B. Bond-Lamberty, S. Frolking, M. A. Wise, and A. C. Janetos, 2010: Climate mitigation and the future of tropical landscapes. Proceedings of the National Academy of Sciences, 107, 19633-19638, doi:10.1073/pnas.0910467107. URL | Detail

  87. Thomson, A. M., K. V. Calvin, S. J. Smith, G. P. Kyle, A. Volke, P. Patel, S. Delgado-Arias, B. Bond-Lamberty, M. A. Wise, and L. E. Clarke, 2011: RCP4.5: A pathway for stabilization of radiative forcing by 2100. Climatic Change, 109, 77-94, doi:10.1007/s10584-011-0151-4. | Detail

  88. ,, 2012: List of Participating Mayors. U.S. Mayors Climate Protection Center, The U.S. Conference of Mayors. URL | Detail

  89. ,, 2009: The Montreal Protocol on Substances that Deplete the Ozone Layer. United Nations Environment Programme Ozone Secretariat, 572 pp. URL | Detail

  90. ,, 2011: U.S. Agriculture and Forestry Greenhouse Gas Inventory: 1990-2008. Technical Bulletin No. 1930. 159 pp., U.S. Department of Agriculture, Climate Change Program Office, Office of the Chief Economist, Washington, D.C. URL | Detail

  91. van Vuuren, D. P., J. Cofala, H. E. Eerens, R. Oostenrijk, C. Heyes, Z. Klimont, M. G. Jden Elzen, and M. Amann, 2006: Exploring the ancillary benefits of the Kyoto Protocol for air pollution in Europe. Energy Policy, 34, 444-460, doi:10.1016/j.enpol.2004.06.012. | Detail

  92. van Vuuren, D. P., J. Edmonds, M. Kainuma, K. Riahi, A. Thomson, K. Hibbard, G. C. Hurtt, T. Kram, V. Krey, and J. F. Lamarque, 2011: The representative concentration pathways: An overview. Climatic Change, 109, 5-31, doi:10.1007/s10584-011-0148-z. URL | Detail

  93. van Vuuren, D. P., S. Deetman, M. G. Jden Elzen, A. Hof, M. Isaac, K. K. Goldewijk, T. Kram, M. A. Beltran, E. Stehfest, and J. van Vliet, 2011: RCP2.6: Exploring the possibility to keep global mean temperature increase below 2° C. Climatic Change, 109, 95-116, doi:10.1007/s10584-011-0152-3. URL | Detail

  94. Vandenbergh, M. P., P. C. Stern, G. T. Gardner, T. Dietz, and J. M. Gilligan, 2010: Implementing the behavioral wedge: Designing and adopting effective carbon emissions reduction programs. Vanderbilt public law research paper no. 10-26. Environmental Law Reporter, 40, 10547. | Detail

  95. Wang, X., and K. R. Smith, 1999: Secondary benefits of greenhouse gas control: Health impacts in China. Environmental Science & Technology, 33, 3056-3061, doi:10.1021/es981360d. URL | Detail

  96. West, J. J., A. M. Fiore, L. W. Horowitz, and D. L. Mauzerall, 2006: Global health benefits of mitigating ozone pollution with methane emission controls. Proceedings of the National Academy of Sciences, 103, 3998-3993, doi:10.1073/pnas.0600201103. URL | Detail

  97. Williams, C. A., J. G. Collatz, J. Masek, and S. N. Goward, 2012: Carbon consequences of forest disturbance and recovery across the conterminous United States. Global Biogeochemical Cycles, 26, GB1005, doi:10.1029/2010gb003947. | Detail

  98. Zhang, F., J. M. Chen, Y. Pan, R. A. Birdsey, S. Shen, W. Ju, and L. He, 2012: Attributing carbon changes in conterminous US forests to disturbance and non-disturbance factors from 1901 to 2010. Journal of Geophysical Research, 117, doi:10.1029/2011JG001930. | Detail

  99. Zheng, D., L. S. Heath, M. J. Ducey, and J. E. Smith, 2011: Carbon changes in conterminous US forests associated with growth and major disturbances: 1992–2001. Environmental Research Letters, 6, 014012, doi:10.1088/1748-9326/6/1/014012. | Detail

The National Climate Assessment summarizes the impacts of climate change on the United States, now and in the future.

A team of more than 300 experts guided by a 60-member Federal Advisory Committee produced the report, which was extensively reviewed by the public and experts, including federal agencies and a panel of the National Academy of Sciences.

United States Global Change Research Program logo United States Global Change Research Program participating agency logos