This website is the digital version of the 2014 National Climate Assessment, produced in collaboration with the U.S. Global Change Research Program.

For the official version, please refer to the PDF in the downloads section. The downloadable PDF is the official version of the 2014 National Climate Assessment.

Credits | Site Map

Search Options

X

Search form

Top

Welcome to the National Climate Assessment

The National Climate Assessment summarizes the impacts of climate change on the United States, now and in the future.

A team of more than 300 experts guided by a 60-member Federal Advisory Committee produced the report, which was extensively reviewed by the public and experts, including federal agencies and a panel of the National Academy of Sciences.

Explore the effects of climate change
United States Global Change Research Program logo
United States Department of Agriculture logo United States Department of Commerce logo United States Department of Defense logo United States Department of Energy logo United States Department of Health and Human Services logo United States Department of the Interior logo United States Department of State logo United States Department of Transportation logo United States Environmental Protection Agency logo National Aeronautics and Space Administration logo National Science Foundation logo Smithsonian Institution logo United States Agency for International Development logo

Future Climate

Human-induced climate change is projected to continue, and it will accelerate significantly if global emissions of heat-trapping gases continue to increase.

Explore future climate.

Next

Introduction

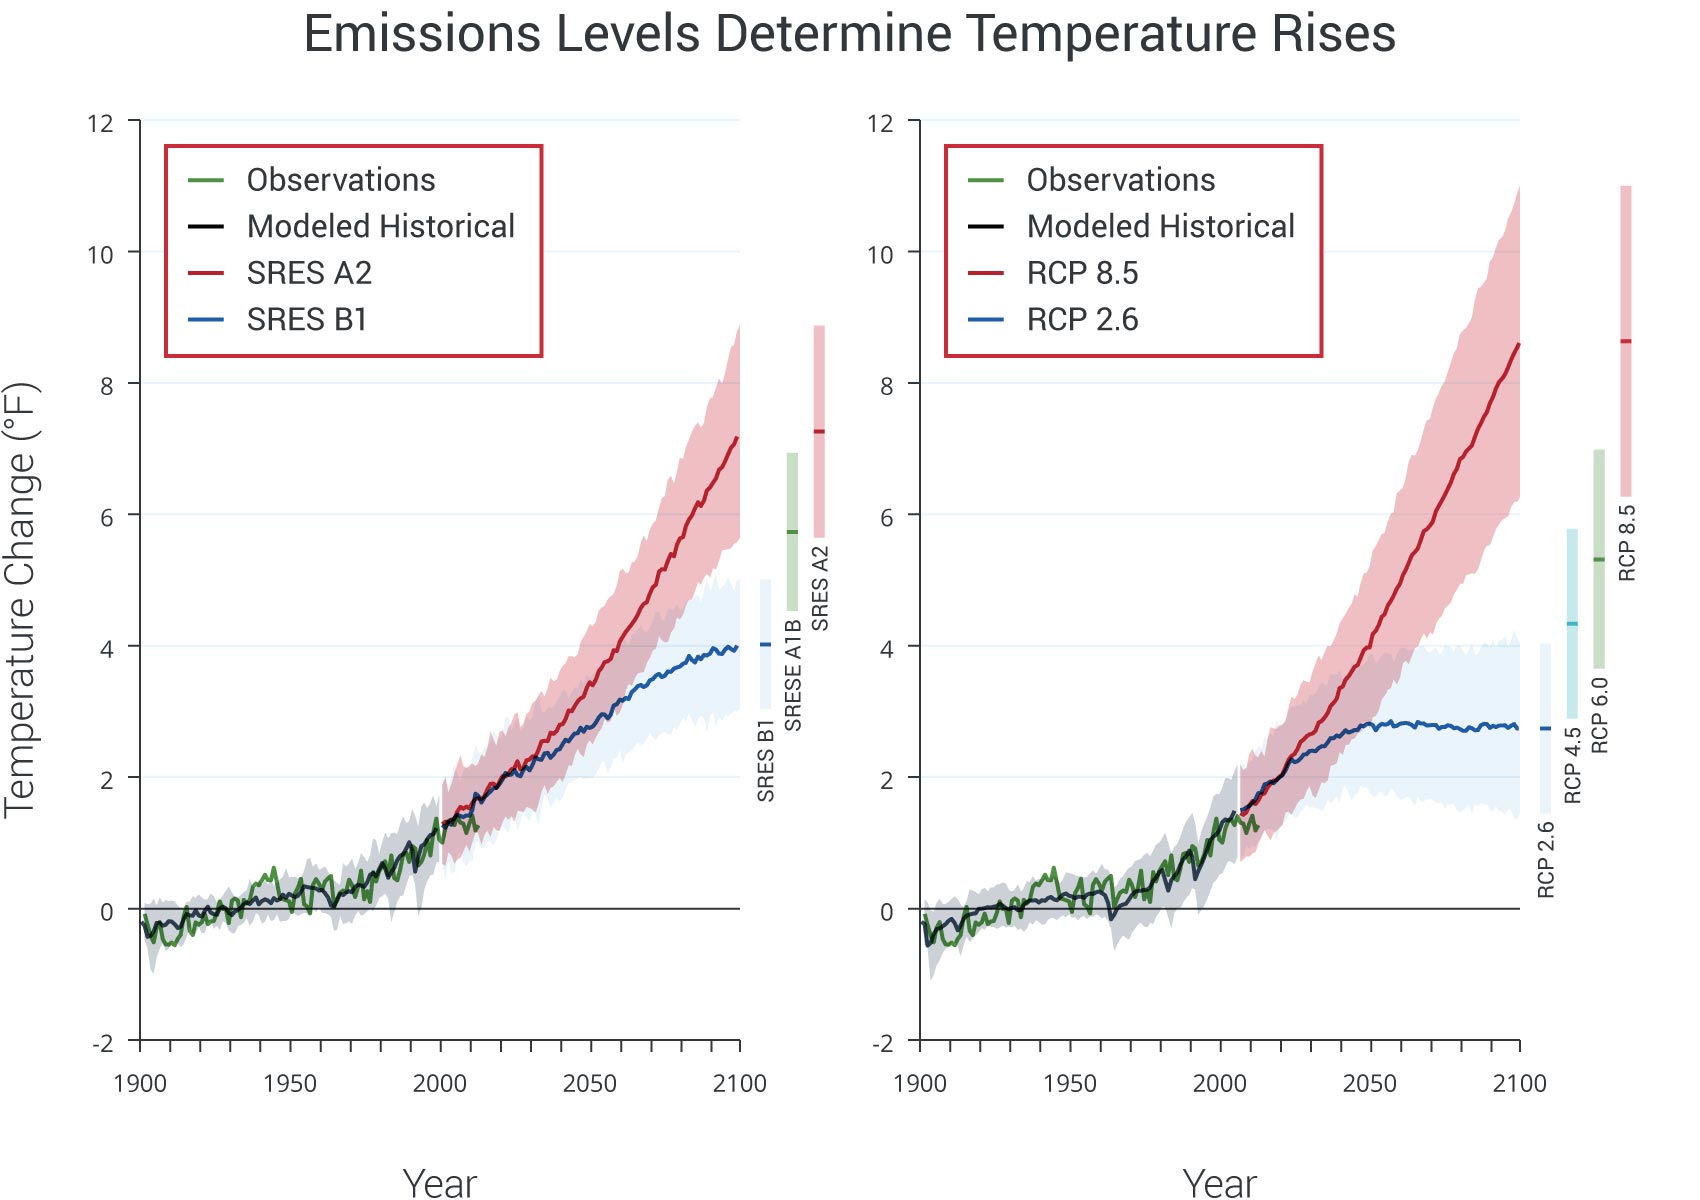
Heat-trapping gases already in the atmosphere have committed us to a hotter future with more climate-related impacts over the next few decades. The magnitude of climate change beyond the next few decades depends primarily on the amount of heat-trapping gases that human activities emit globally, now and in the future.

Projected Temperature Change

Projected Temperature Change

Lower Emissions (B1)Higher Emissions (A2)

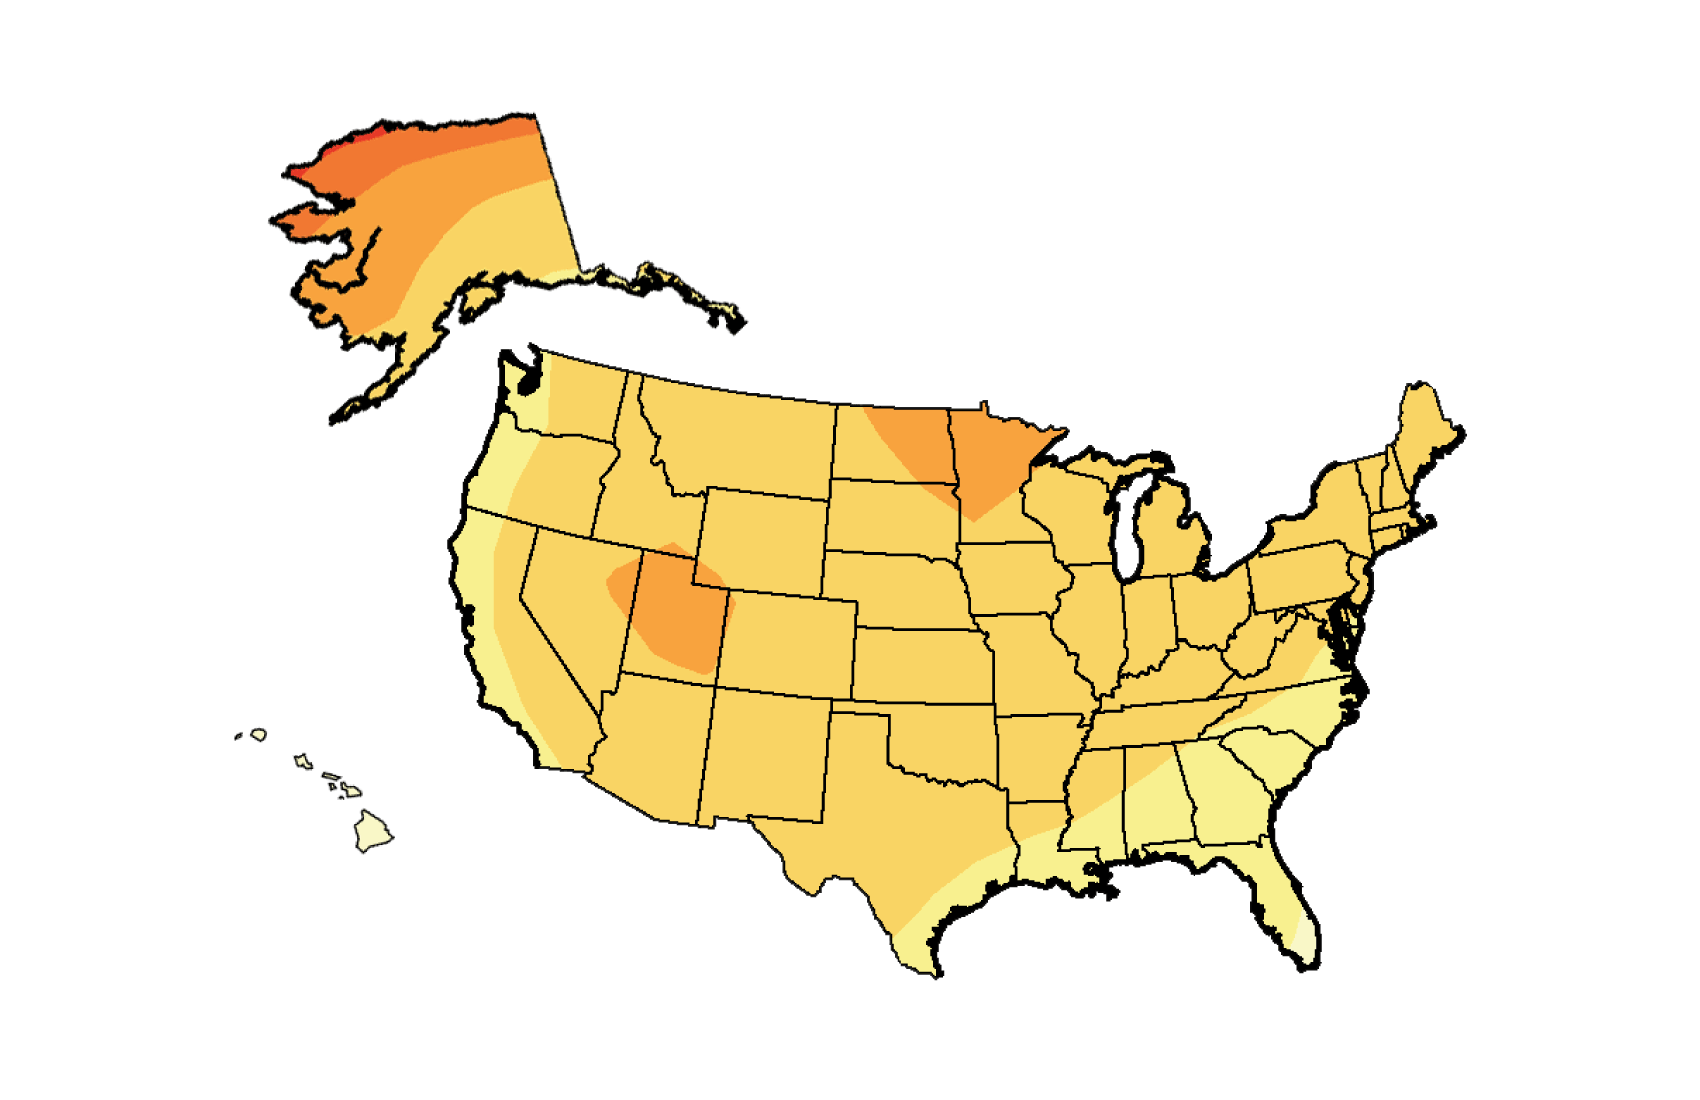
Maps show projected change in average surface air temperature in the later part of this century (2071-2099) relative to the later part of the last century (1970-1999) under a scenario that assumes substantial reductions in heat trapping gases (B1) and a higher emissions scenario that assumes continued increases in global emissions (A2). These scenarios are used throughout this report for assessing impacts under lower and higher emissions. (Figure source: NOAA NCDC / CICS-NC).

Details/Download

Projected Changes in Soil Moisture

Projected Changes in Soil Moisture

Lower Emissions Scenario (B1)Higher Emissions Scenario (A2)

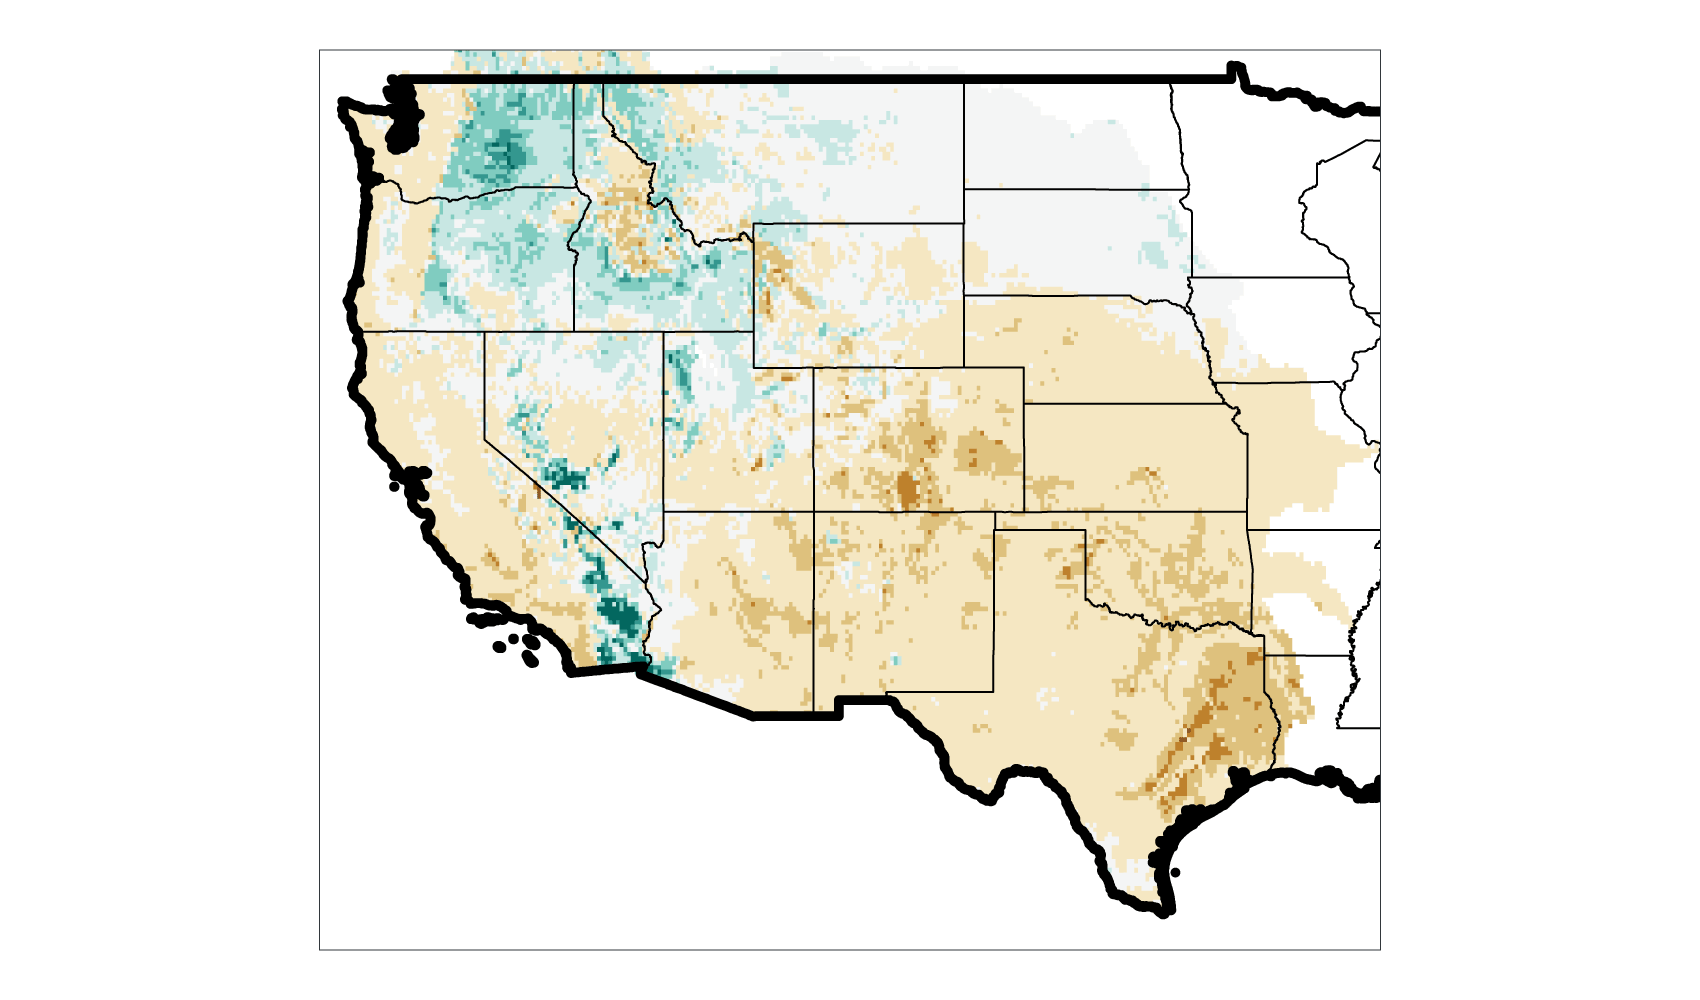
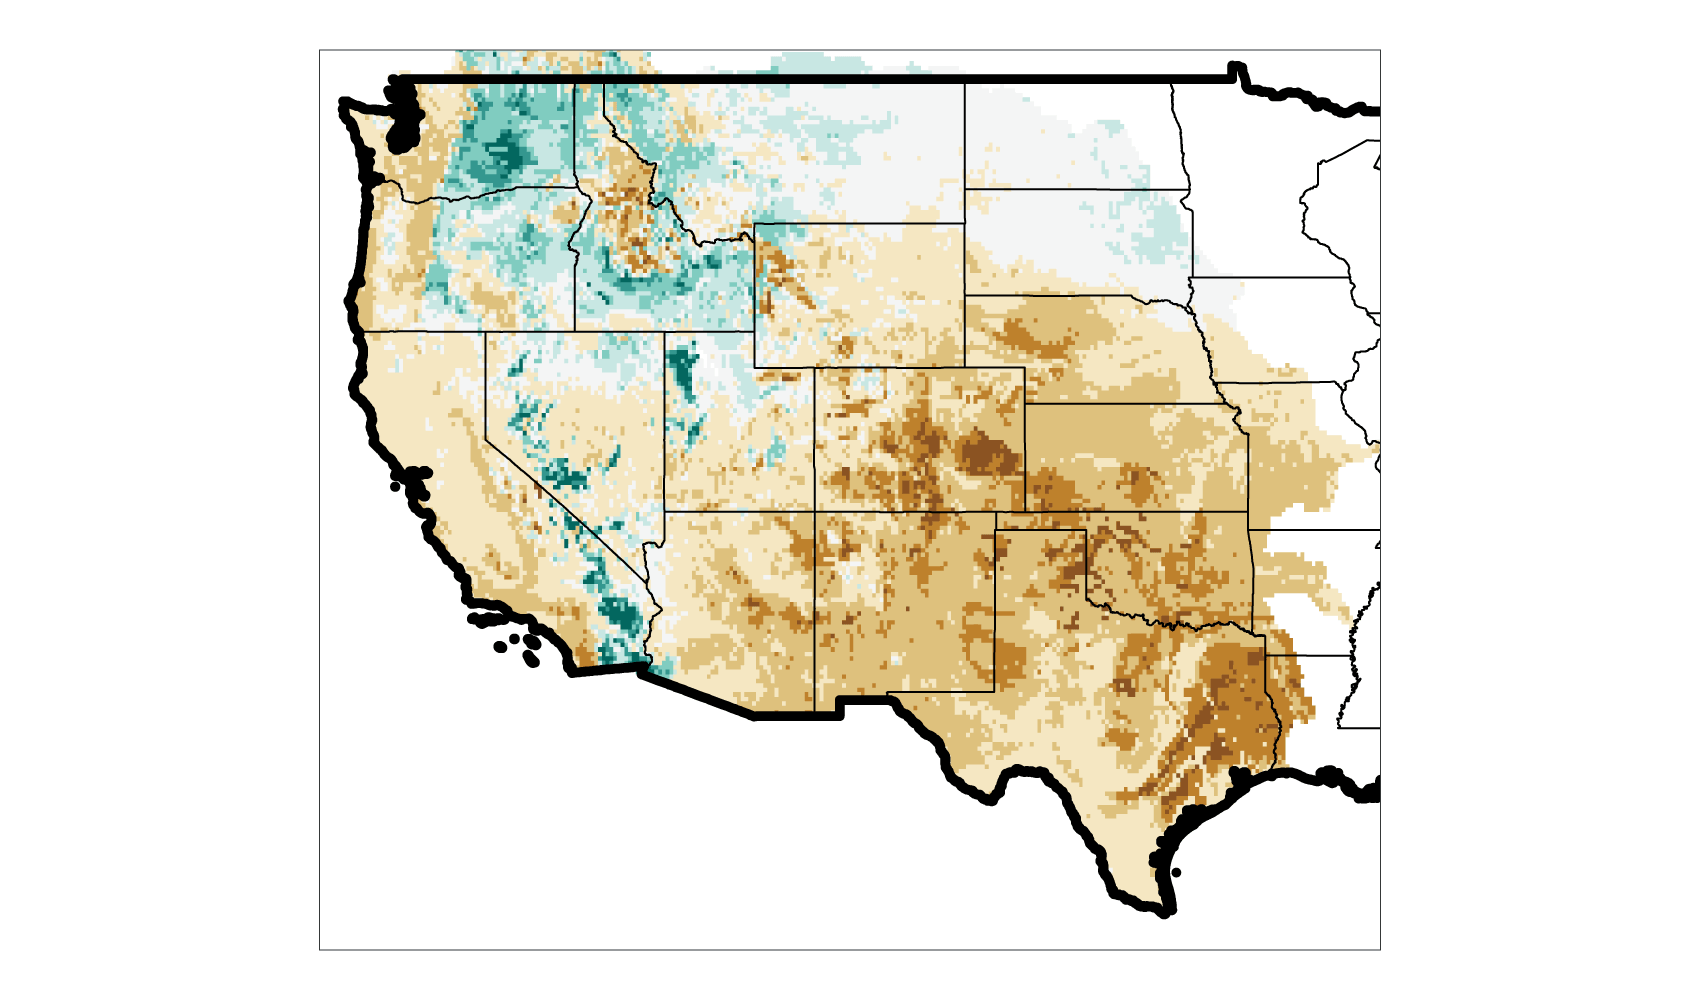
Increased temperatures and changing precipitation patterns will alter soil moisture, which is important for agriculture and ecosystems and has many societal implications. These maps show average change in soil moisture compared to 1971-2000, as projected for late this century (2071-2100) under two emissions scenarios, a lower scenario (B1) and a higher scenario (A2).9,10,11,12,13,14,15 Eastern U.S. is not displayed because model simulations were only run for the area shown. (Figure source: NOAA NCDC / CICS-NC).

Details/Download

Projected Precipitation Change by Season

Projected Precipitation Change by Season

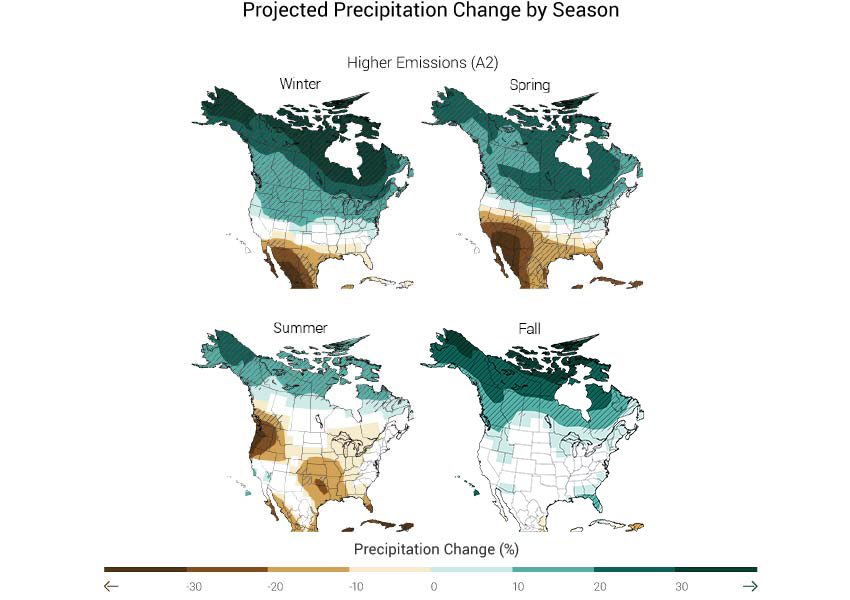
Climate change affects more than just temperature. The location, timing, and amounts of precipitation will also change as temperatures rise. Maps show projected percent change in precipitation in each season for 2071-2099 (compared to the period 1970-1999) under an emissions scenario that assumes continued increases in emissions (A2). Teal indicates precipitation increases, and brown, decreases. Hatched areas indicate that the projected changes are significant and consistent among models. White areas indicate that the changes are not projected to be larger than could be expected from natural variability. In general, the northern part of the U.S. is projected to see more winter and spring precipitation, while the southwestern U.S. is projected to experience less precipitation in the spring. Wet regions are generally projected to become wetter while dry regions become drier. Summer drying is projected for parts of the U.S., including the Northwest and southern Great Plains. (Figure source: NOAA NCDC / CICS-NC).

Details/Download

Change in Maximum Number of Consecutive Dry Days

Change in Maximum Number of Consecutive Dry Days

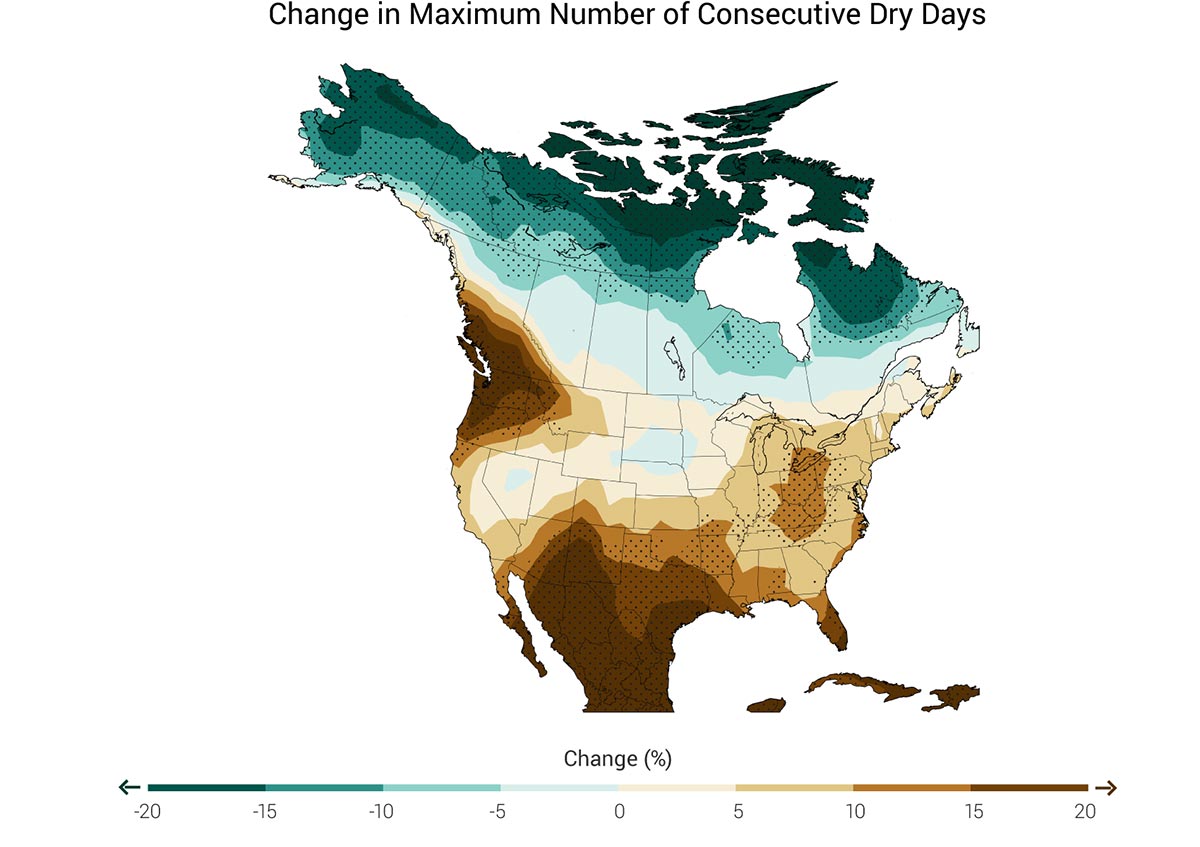
Map shows change in the number of consecutive dry days (days receiving less than 0.04 inches of precipitation) at the end of this century (2070-2099) relative to the end of last century (1971-2000) under the highest scenario considered in this report, RCP 8.5. Stippling indicates areas where changes are consistent among at least 80% of the 25 models used in this analysis. (Figure source: NOAA NCDC / CICS-NC).

Details/Download

Sea level rise

Global sea level has risen about 8 inches since reliable record keeping began in 1880. It is projected to rise another 1 to 4 feet by 2100. The oceans are absorbing over 90% of the increased atmospheric heat associated with emissions from human activity.5 Like mercury in a thermometer, water expands as it warms up (this is referred to as “thermal expansion”) causing sea levels to rise. Melting of glaciers and ice sheets is also contributing to sea level rise at increasing rates.6

Past and Projected Changes in Global Sea Level

Past and Projected Changes in Global Sea Level

Figure shows estimated, observed, and possible amounts of global sea level rise from 1800 to 2100, relative to the year 2000. Estimates from proxy data1 (for example, based on sediment records) are shown in red (1800-1890, pink band shows uncertainty), tide gauge data in blue for 1880-2009,2 and satellite observations are shown in green from 1993 to 2012.3 The future scenarios range from 0.66 feet to 6.6 feet in 2100.4 These scenarios are not based on climate model simulations, but rather reflect the range of possible scenarios based on other kinds of scientific studies. The orange line at right shows the currently projected range of sea level rise of 1 to 4 feet by 2100, which falls within the larger risk-based scenario range. The large projected range reflects uncertainty about how glaciers and ice sheets will react to the warming ocean, the warming atmosphere, and changing winds and currents. As seen in the observations, there are year-to-year variations in the trend. (Figure source: Adapted from Parris et al. 20124 with input from NASA Jet Propulsion Laboratory).

Details/Download

Where we are heading

Both voluntary activities and a variety of policies and measures that lower emissions are currently in place at federal, state, and local levels in the U.S., even though there is no comprehensive national climate legislation. Over the remainder of this century, aggressive and sustained greenhouse gas emission reductions by the U.S. and by other nations would be needed to reduce global emissions to a level consistent with the lower scenario (B1) analyzed in this assessment.

Emission Levels Determine Temperature Rises

Emission Levels Determine Temperature Rises

Different amounts of heat-trapping gases released into the atmosphere by human activities produce different projected increases in Earth’s temperature. In the figure, each line represents a central estimate of global average temperature rise for a specific emissions pathway (relative to the 1901-1960 average). Shading indicates the range (5th to 95th percentile) of results from a suite of climate models. Projections in 2099 for additional emissions pathways are indicated by the bars to the right of each panel. In all cases, temperatures are expected to rise, although the difference between lower and higher emissions pathways is substantial.

The left panel shows the two main scenarios (SRES) used in this report: A2 assumes continued increases in emissions throughout this century, and B1 assumes significant emissions reductions beginning around 2050, though not due explicitly to climate change policies. The right panel shows newer analyses, which are results from the most recent generation of climate models (CMIP5) using the most recent emissions pathways (RCPs). Some of these new projections explicitly consider climate policies that would result in emissions reductions, which the SRES set did not.7,8 The newest set includes both lower and higher pathways than did the previous set. The lowest emissions pathway shown here, RCP 2.6, assumes immediate and rapid reductions in emissions and would result in about 2.5°F of warming in this century. The highest pathway, RCP 8.5, roughly similar to a continuation of the current path of global emissions increases, is projected to lead to more than 8°F warming by 2100, with a high-end possibility of more than 11°F. (Data from CMIP3, CMIP5, and NOAA NCDC).

Details/Download

References

  1. ,, 2011: Snow, Water, Ice and Permafrost in the Arctic (SWIPA): Climate Change and the Cryosphere. Arctic Monitoring and Assessment Programme, 538 pp. URL | Detail

  2. Church, J. A., N. J. White, L. F. Konikow, C. M. Domingues, J. G. Cogley, E. Rignot, J. M. Gregory, M. R. van den Broeke, A. J. Monaghan, and I. Velicogna, 2011: Revisiting the Earth’s sea-level and energy budgets from 1961 to 2008. Geophysical Research Letters, 38, L18601, doi:10.1029/2011GL048794. | Detail

  3. Church, J. A., and N. J. White, 2011: Sea-level rise from the late 19th to the early 21st century. Surveys in Geophysics, 32, 585-602, doi:10.1007/s10712-011-9119-1. | Detail

  4. Collins, M., R. Knutti, J. M. Arblaster, J. - L. Dufresne, T. Fichefet, F. P., X. Gao, W. J. Gutowski, T. Johns, G. Krinner, M. Shongwe, C. Tebaldi, A. J. Weaver, and M. Wehner, 2013: Ch. 12: Long-term climate change: Projections, commitments and irreversibility. Climate Change 2013: The Physical Science Basis. Contribution of Working Group I to the Fifth Assessment Report of the Intergovernmental Panel on Climate Change, T.F. Stocker, Qin, D., Plattner, G.-K., Tignor, M., Allen, S.K., Boschung, J., Nauels,., Xia, Y., Bex, V., and Midgley, P.M., Eds., Cambridge University Press, 1029-1136. URL | Detail

  5. Dai, A., 2012: Increasing drought under global warming in observations and models. Nature Climate Change, 3, 52-58, doi:10.1038/nclimate1633. URL | Detail

  6. ,, 2007: Climate Change 2007: The Physical Science Basis. Contribution of Working Group I to the Fourth Assessment Report of the Intergovernmental Panel on Climate Change. Cambridge University Press, 996 pp. URL | Detail

  7. Kemp, A. C., B. P. Horton, J. P. Donnelly, M. E. Mann, M. Vermeer, and S. Rahmstorf, 2011: Climate related sea-level variations over the past two millennia. Proceedings of the National Academy of Sciences, 108, 11017-11022, doi:10.1073/pnas.1015619108. URL | Detail

  8. Liang, X., E. F. Wood, and D. P. Lettenmaier, 1996: Surface soil moisture parameterization of the VIC-2L model: Evaluation and modification. Global and Planetary Change, 13, 195-206, doi:10.1016/0921-8181(95)00046-1. | Detail

  9. Liang, X., D. P. Lettenmaier, E. F. Wood, and S. J. Burges, 1994: A simple hydrologically based model of land surface water and energy fluxes for general circulation models. Journal of Geophysical Research, 99, 14415-14428, doi:10.1029/94JD00483. URL | Detail

  10. Maurer, E. P., A. W. Wood, J. C. Adam, D. P. Lettenmaier, and B. Nijssen, 2002: A long-term hydrologically based dataset of land surface fluxes and states for the conterminous United States. Journal of Climate, 15, 3237-3251, doi:10.1175/1520-0442(2002)0152.0.CO;2. URL | Detail

  11. Nerem, R. S., D. P. Chambers, C. Choe, and G. T. Mitchum, 2010: Estimating mean sea level change from the TOPEX and Jason altimeter missions. Marine Geodesy, 33, 435-446, doi:10.1080/01490419.2010.491031. URL | Detail

  12. Nijssen, B., D. P. Lettenmaier, X. Liang, S. W. Wetzel, and E. F. Wood, 1997: Streamflow simulation for continental-scale river basins. Water Resources Research, 33, 711-724, doi:10.1029/96WR03517. URL | Detail

  13. Parris, A., P. Bromirski, V. Burkett, D. Cayan, M. Culver, J. Hall, R. Horton, K. Knuuti, R. Moss, J. Obeysekera, A. Sallenger, and J. Weiss, 2012: Global Sea Level Rise Scenarios for the United States National Climate Assessment. NOAA Tech Memo OAR CPO-1. 37 pp., National Oceanic and Atmospheric Administration, Silver Spring, MD. URL | Detail

  14. Wood, A. W., and D. P. Lettenmaier, 2006: A test bed for new seasonal hydrologic forecasting approaches in the western United States. Bulletin of the American Meteorological Society, 87, 1699-1712, doi:10.1175/BAMS-87-12-1699. | Detail

  15. Wood, A. W., A. Kumar, and D. P. Lettenmaier, 2005: A retrospective assessment of National Centers for Environmental Prediction climate model–based ensemble hydrologic forecasting in the western United States. Journal of Geophysical Research, 110, 16, doi:10.1029/2004JD004508. | Detail

The National Climate Assessment summarizes the impacts of climate change on the United States, now and in the future.

A team of more than 300 experts guided by a 60-member Federal Advisory Committee produced the report, which was extensively reviewed by the public and experts, including federal agencies and a panel of the National Academy of Sciences.

United States Global Change Research Program logo United States Global Change Research Program participating agency logos