This website is the digital version of the 2014 National Climate Assessment, produced in collaboration with the U.S. Global Change Research Program.

For the official version, please refer to the PDF in the downloads section. The downloadable PDF is the official version of the 2014 National Climate Assessment.

Credits | Site Map

Search Options

X

Search form

Top

Welcome to the National Climate Assessment

The National Climate Assessment summarizes the impacts of climate change on the United States, now and in the future.

A team of more than 300 experts guided by a 60-member Federal Advisory Committee produced the report, which was extensively reviewed by the public and experts, including federal agencies and a panel of the National Academy of Sciences.

Explore the effects of climate change
United States Global Change Research Program logo
United States Department of Agriculture logo United States Department of Commerce logo United States Department of Defense logo United States Department of Energy logo United States Department of Health and Human Services logo United States Department of the Interior logo United States Department of State logo United States Department of Transportation logo United States Environmental Protection Agency logo National Aeronautics and Space Administration logo National Science Foundation logo Smithsonian Institution logo United States Agency for International Development logo

Transportation

Sea level rise, storm surge, and extreme weather events affect the reliability and capacity of U.S. transportation systems. Coastal infrastructure faces particular risks. Extreme weather events disrupt transportation networks.

Explore impacts to transportation.

Next

Convening Lead Authors

Henry G. Schwartz, HGS Consulting, LLC

Michael Meyer, Parsons Brinckerhoff

Lead Authors

Cynthia J. Burbank, Parsons Brinckerhoff

Michael Kuby, Arizona State University

Clinton Oster, Indiana University

John Posey, East-West Gateway Council of Governments

Edmond J Russo, U.S. Army Corps of Engineers

Arthur Rypinski, U.S. Department of Transportation

Introduction

The U.S. economy depends on the personal and freight mobility provided by the country’s transportation system. Essential products and services like energy, food, manufacturing, and trade all depend in interrelated ways on the reliable functioning of these transportation components. Disruptions to transportation systems, therefore, can cause large economic and personal losses.72 The national transportation system is composed of four main components that are increasingly vulnerable to climate change impacts:

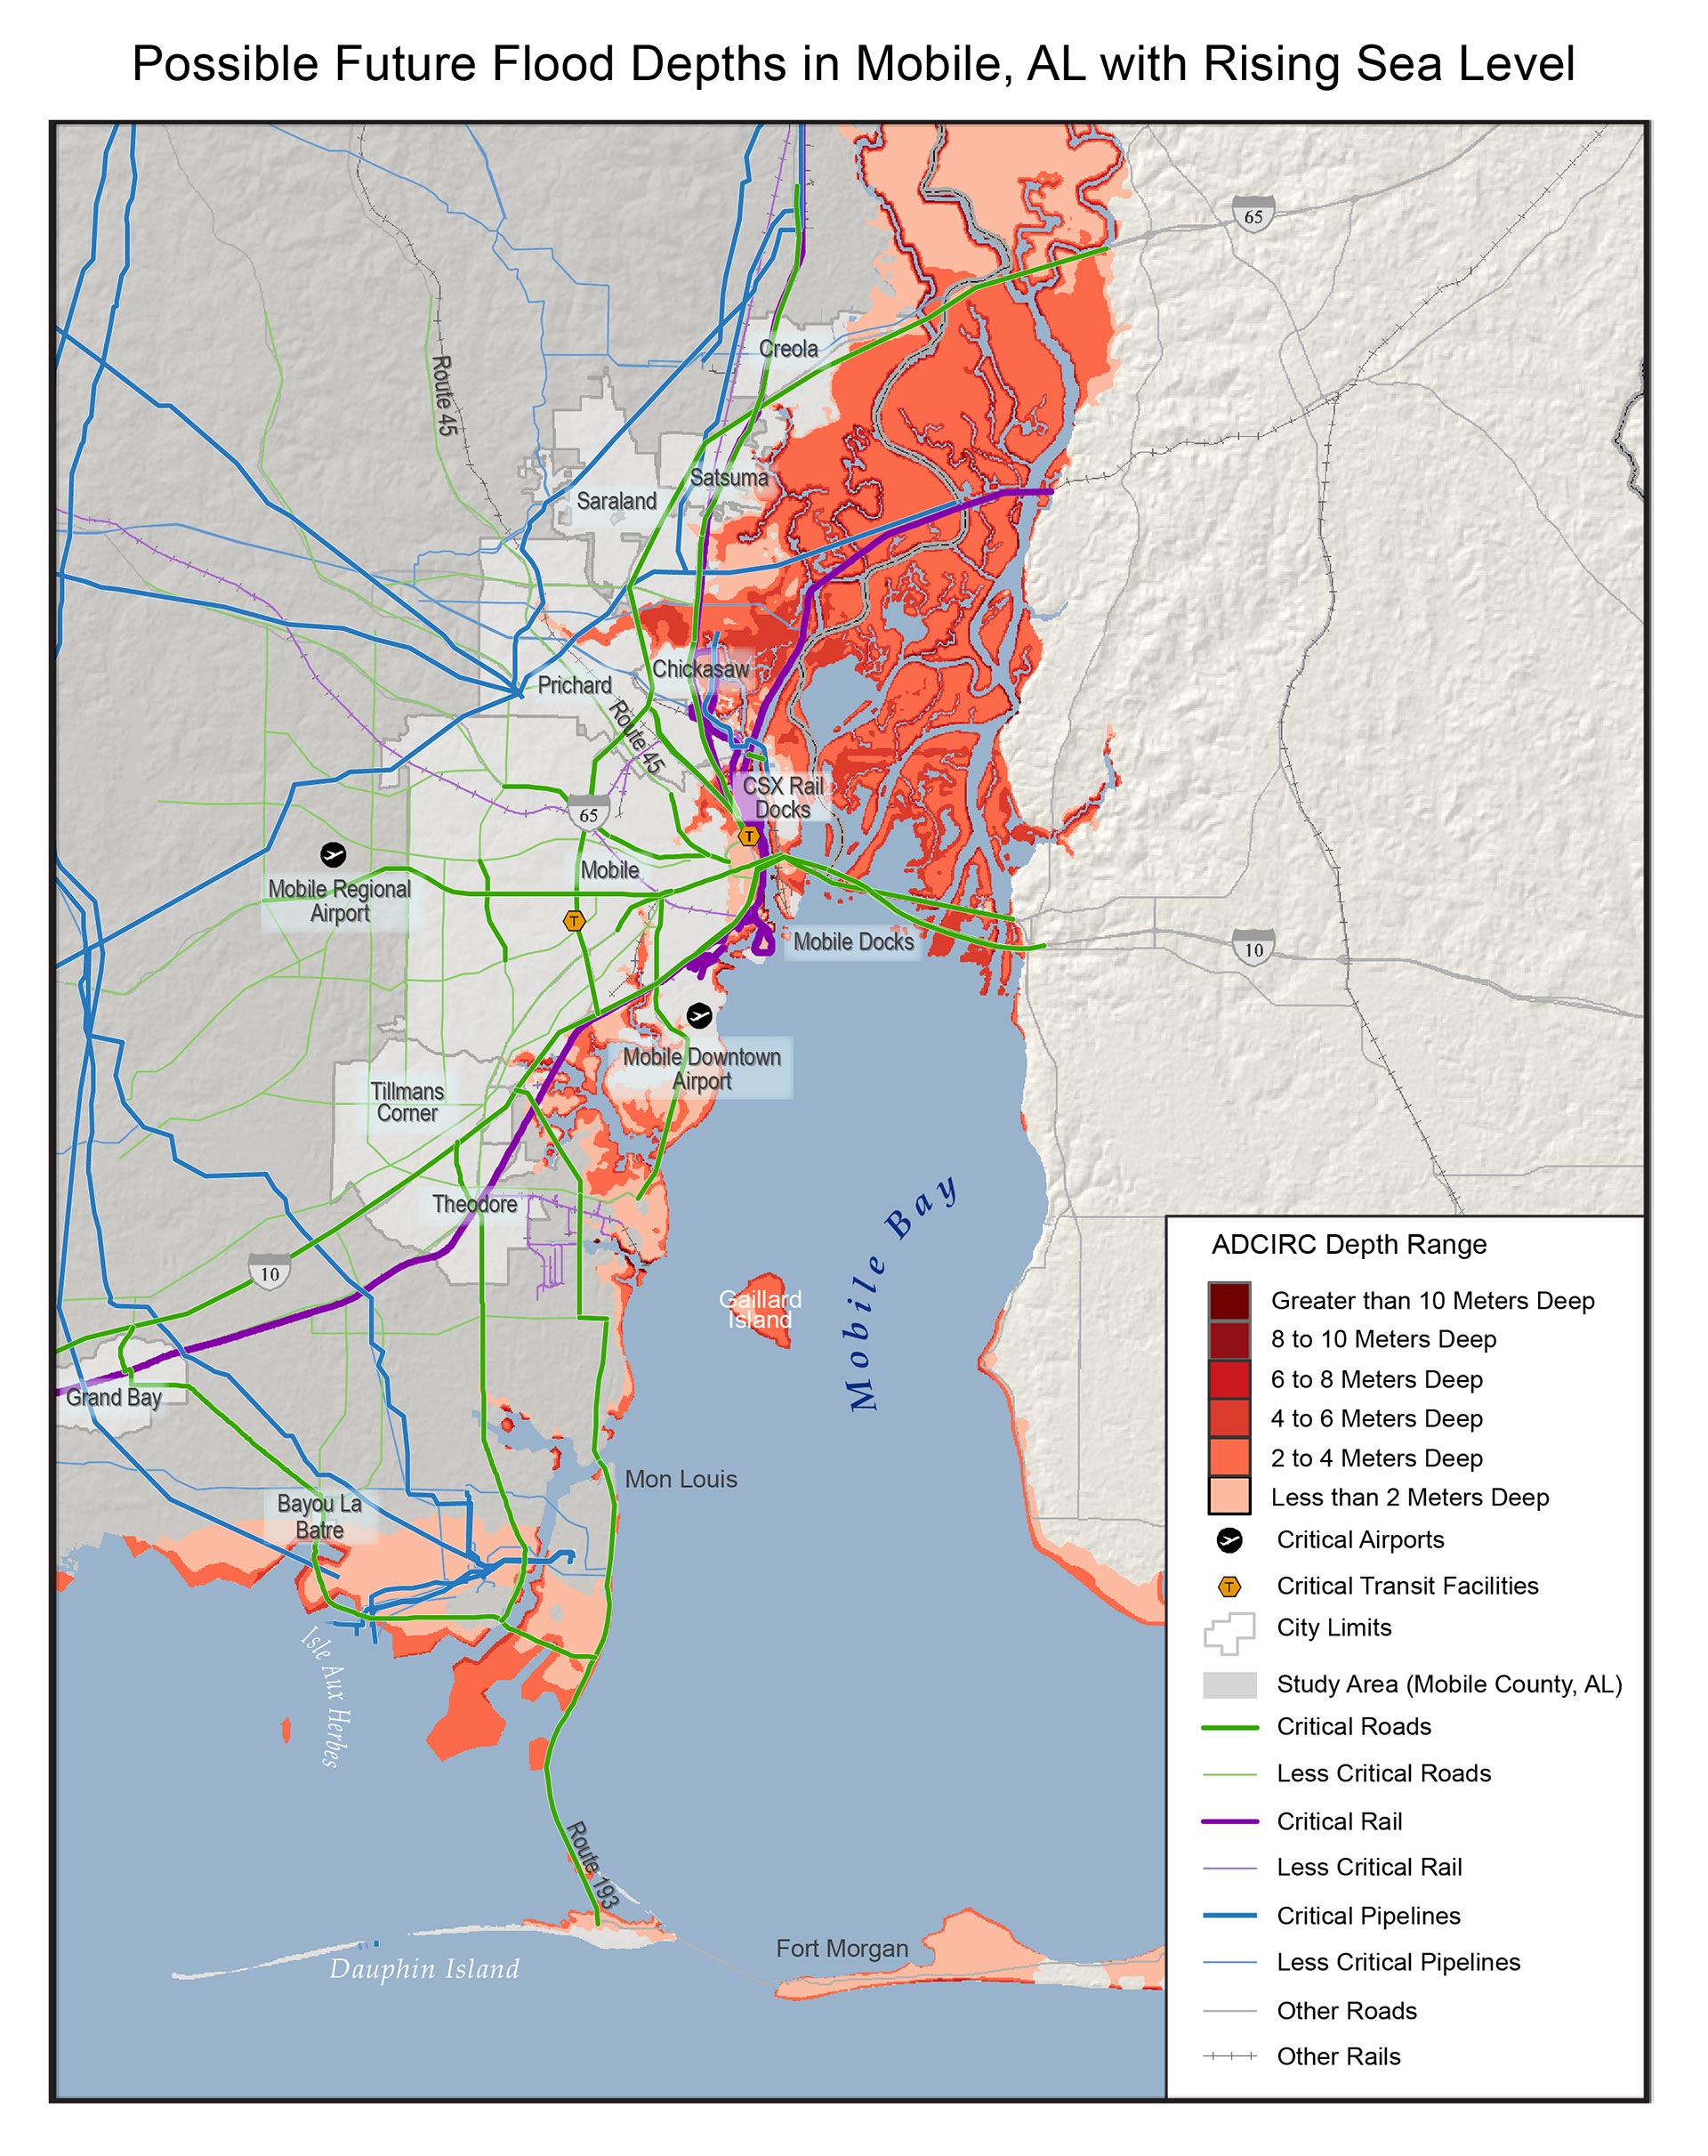
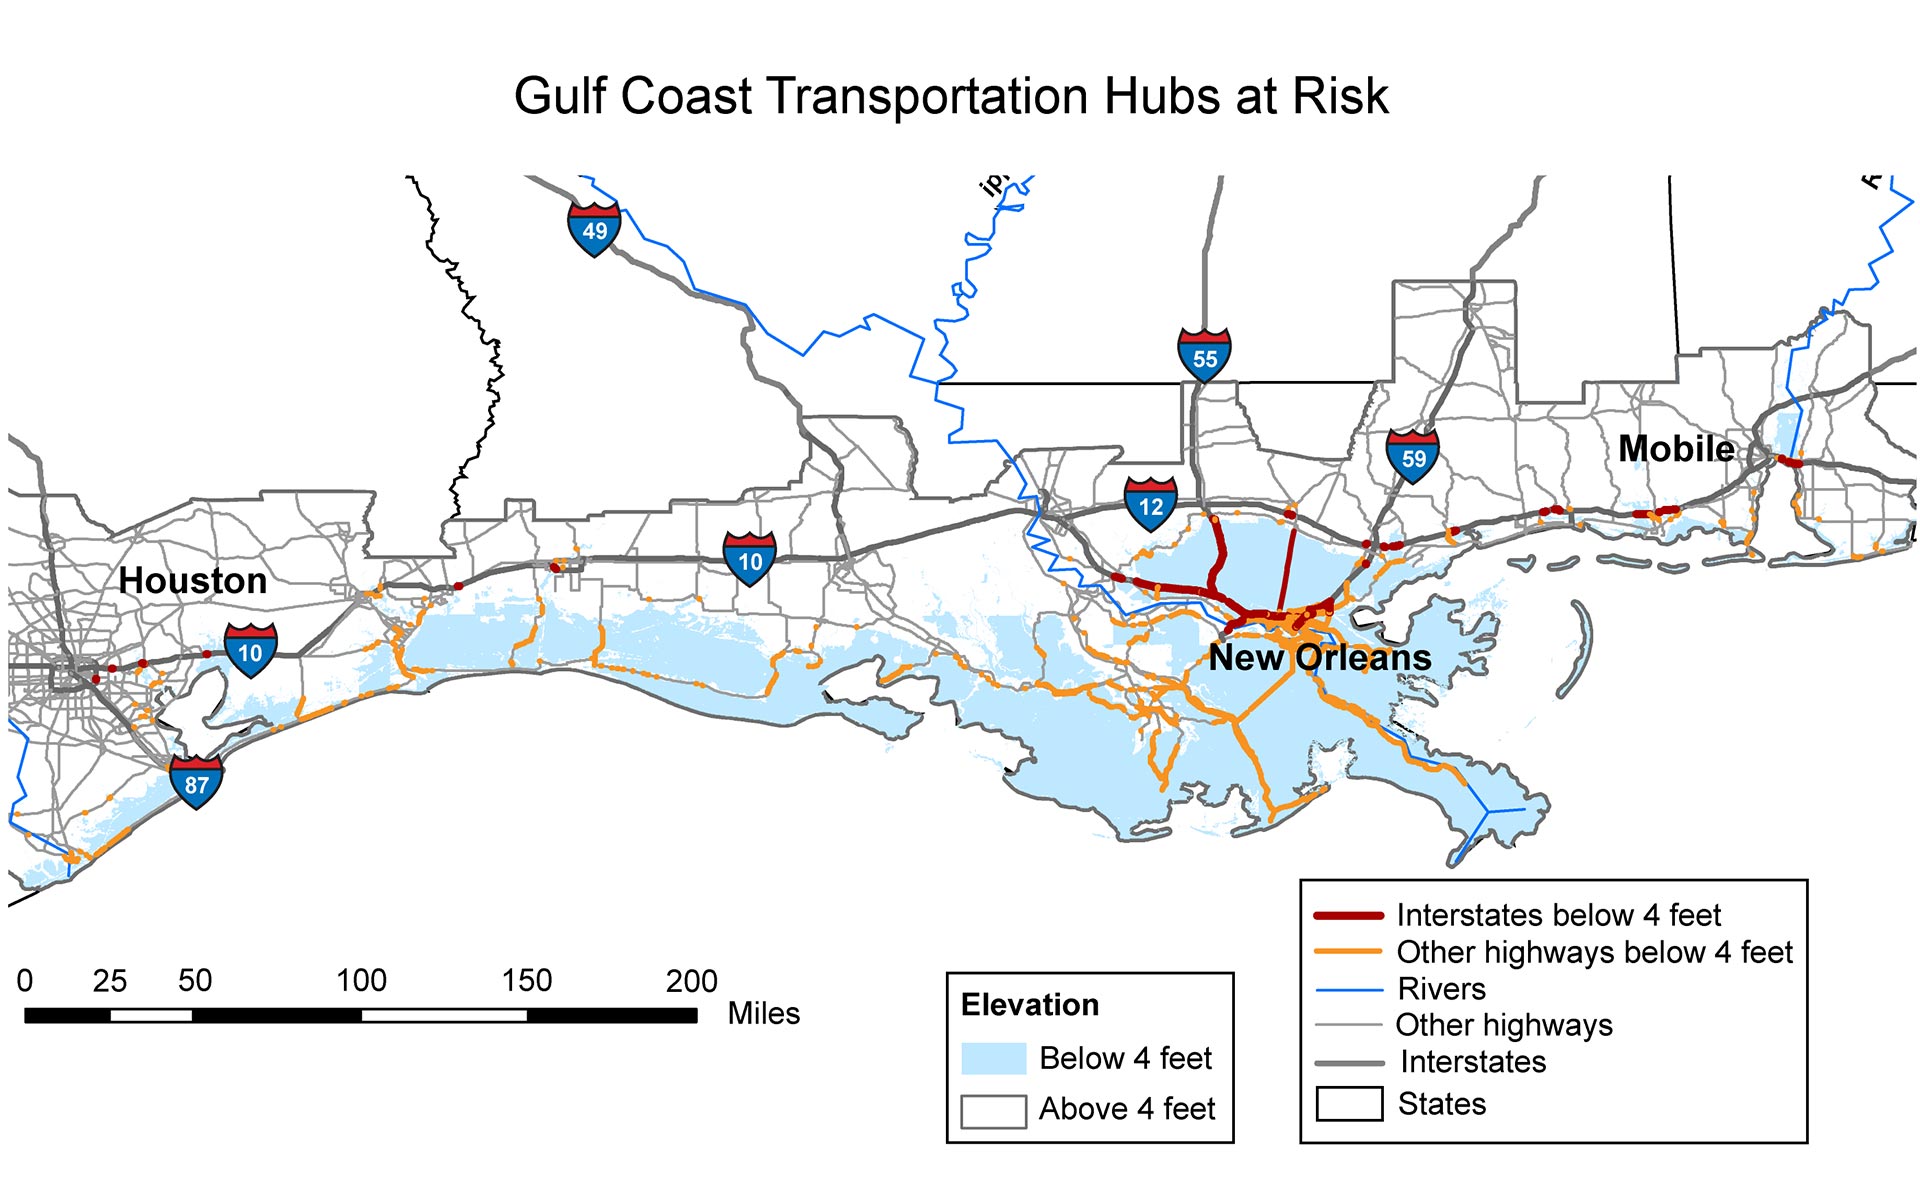
  • fixed node infrastructure, such as ports, airports, and rail terminals;
  • fixed route infrastructure, such as roads, bridges, pedestrian/bicycle trails and lanes, locks, canals/channels, light rail, subways, freight and commuter railways, and pipelines, with mixed public and private ownership and management;
  • vehicles, such as cars, transit buses, and trucks; transit and railcars and locomotives; ships and barges; and aircraft – many privately owned; and
  • the people, institutions, laws, policies, and information systems that convert infrastructure and vehicles into working transportation networks.

Besides being affected by climate changes, transportation systems also contribute to changes in the climate through emissions. In 2010, the U.S. transportation sector accounted for 27% of total U.S. greenhouse gas emissions, with cars and trucks accounting for 65% of that total.73 Petroleum accounts for 93% of the nation’s transportation energy use.73 This means that policies and behavioral changes aimed at reducing greenhouse gas emissions will have significant implications for the various components of the transportation sector.

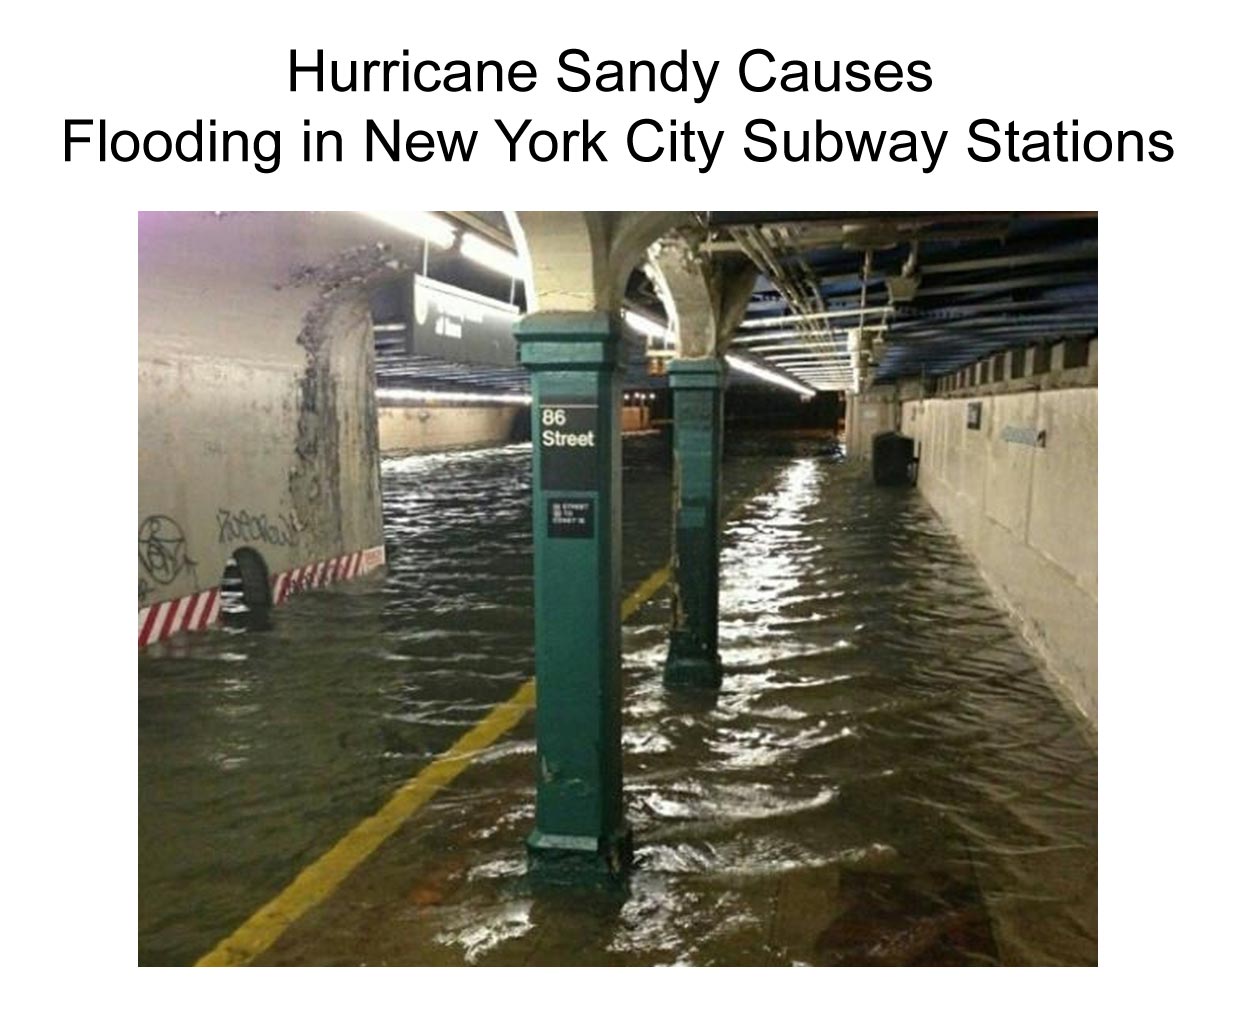
Weather events influence the daily and seasonal operation of transport systems.56,55,54 Transportation systems are already experiencing costly climate change related impacts. Many inland states – for example, Vermont, Tennessee, Iowa, and Missouri – have experienced severe precipitation events, hail, and flooding during the past three years, damaging roads, bridges, and rail systems and the vehicles that use them. Over the coming decades, all regions and modes of transportation will be affected by increasing temperatures, more extreme weather events, and changes in precipitation. Concentrated transportation impacts are likely in Alaska and along seacoasts.

cars backed up ©Tom Mihalek/Reuters/Corbis

Climate trends affect the design of transport infrastructure, which is expensive and designed for long life (typically 50 to 100 years). The estimated value of U.S. transportation facilities in 2010 was $4.1 trillion.74 As climatic conditions shift, portions of this infrastructure will increasingly be subject to climatic stresses that will reduce the reliability and capacity of transportation systems.1 Transportation systems are also vulnerable to interruptions in fuel and electricity supply, as well as communications disruptions – which are also subject to climatic stresses.1,75 For example, power outages resulting from Hurricane Katrina shut down three major petroleum pipelines for two days, and the systems operated at reduced capacities for two weeks.76

Climate change will affect transportation systems directly, through infrastructure damage, and indirectly, through changes in trade flows, agriculture, energy use, and settlement patterns. If, for instance, corn cultivation shifts northward in response to rising temperatures, U.S. agricultural products may flow to markets from different origins by different routes.77 If policy measures and technological changes reduce greenhouse gas emissions by affecting fuel types, there will likely be significant impacts on the transportation of energy supplies (such as pipelines and coal trains) and on the cost of transportation to freight and passenger users.5

Shifts in demographic trends, land-use patterns, and advances in transportation technology over the next few decades will have profound impacts on how the nation’s transportation system functions, its design, and its spatial extent. As transportation officials shape the future transportation system to address new demands, future climate conditions should be considered as part of the planning and decision-making process.

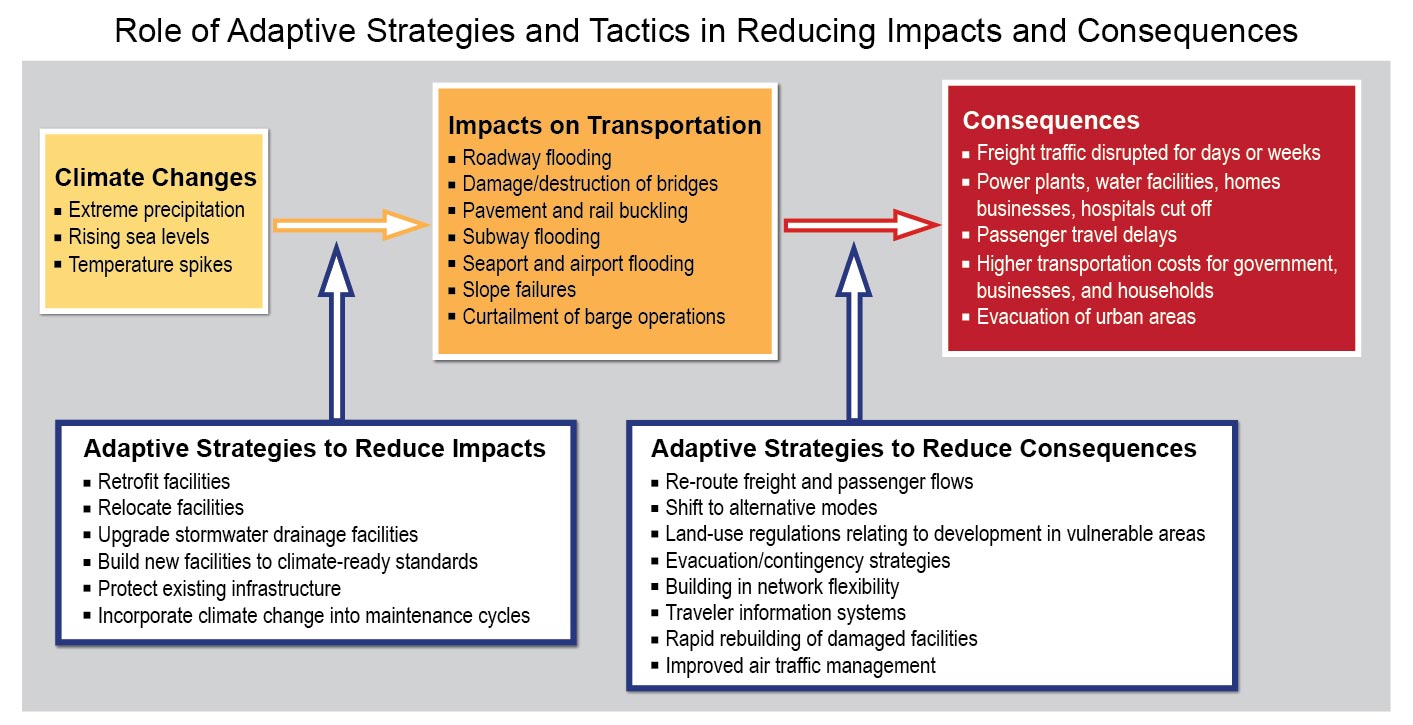
Disruptions to transportation system capacity and reliability can be partially offset by adaptations. Transportation systems as networks may use alternative routes around damaged elements or shift traffic to undamaged modes. Other adaptation actions include new infrastructure designs for future climate conditions, asset management programs, at-risk asset protection, operational changes, and abandoning/relocating infrastructure assets that would be too expensive to protect.2 As new and rehabilitated transportation systems are developed, climate change impacts should be routinely incorporated into the planning for these systems.

There will be challenges in adapting transportation systems to climate related changes, particularly when factoring in projected growth in the transportation sector. A National Surface Transportation Policy and Revenue Commission in 2007 forecast the following annual average growth rates: average annual tonnage growth rates of 2.1% for trucks, 1.9% for rail, and 1.2% for waterborne transportation, and an average annual passenger vehicle miles traveled growth rate of 1.82% through 2035 and 1.72% through 2055.78

Key Message 1: Reliability and Capacity at Risk

The impacts from sea level rise and storm surge, extreme weather events, higher temperatures and heat waves, precipitation changes, Arctic warming, and other climatic conditions are affecting the reliability and capacity of the U.S. transportation system in many ways.

Supporting Evidence
close

Supporting Evidence

Key Message Process:

In developing key messages, the chapter author team engaged, via teleconference, in multiple technical discussions from January through May 2012 as they reviewed numerous peer reviewed publications. Technical input reports (21) on a wide range of topics were also received and reviewed as part of the Federal Register Notice solicitation for public input. The author team’s review included a foundational Technical Input Report for the National Climate Assessment, “Climate Impacts and U.S. Transportation.”8 Other published literature and professional judgment were also considered as the chapter key messages were developed. The chapter author team met in St. Louis, MO, in April 2012 for expert deliberation and finalization of key messages.

Description of evidence base

Climate impacts in the form of sea level rise, changing frequency of extreme weather events, heat waves, precipitation changes, Arctic warming, and other climatic conditions are documented in Ch. 2: Our Changing Climate of this report.

Climate can be described as the frequency distribution of weather over time. Existing weather conditions, flooding, and storm surge demonstrably affect U.S. transportation systems. By changing the frequency of these weather conditions, climate change will inevitably affect the reliability and capacity of U.S. transportations systems. This view is supported by multiple studies of the impacts of weather and climate change on particular transportation systems or particular regions.

An aggregate summary of impacts of climate change on U.S. transportation can be found in NRC 2008.1 A paper commissioned for NRC 2008 considers specific impacts of various forms of climate change on infrastructure, for example, possible future constraints on infrastructure.2 The effects of climate on transit systems are summarized in Hodges 2011.3 The impact of heat and other climate effects on rail systems are described by Hodges 2011 and Rossetti 2002.3,4

Future impacts of sea level rise and other climatic effects on transportation systems in the Gulf Coast were examined by CCSP 2008.5 The impacts of climate change on New York State, including its transportation system, were undertaken by Rosenzweig et al. 2011.6 Impacts of sea level rise on transportation infrastructure for the mid-Atlantic were also discussed in CCSP 2009 SAP 4.1, Ch. 7.7

Weather impacts on road systems are discussed in “Climate Impacts and U.S. Transportation”8 and numerous other sources. Weather impacts on aviation operations are discussed in Kulesa 20039 and numerous other sources.

In addition, the key message and supporting text summarize extensive evidence documented in “Climate Impacts and U.S. Transportation.”8

Additional peer-reviewed publications discuss the fact that Arctic warming is affecting existing Alaskan transportation infrastructure today, and is projected to allow the seasonal opening of the Northwest Passage to freight shipment.10

New information and remaining uncertainties

Recent changes in global sea level rise estimates documented in this report (Ch.2: Our Changing Climate, Key Message 10) have not been incorporated into existing regional studies of coastal areas. In addition, recent research by USGS on the interaction between sea level rise, wave action, and local geology have been incorporated in only a few studies.11

Specific estimates of climate change impacts on transportation are acutely sensitive to regional projections of climate change and, in particular, to the scale, timing, and type of predicted precipitation. New (CMIP5-based) regional climate projections will therefore affect most existing specific estimates of climate change impacts on transportation. Transportation planning in the face of uncertainties about regional-scale climate impacts presents particular challenges.

Impacts of climate on transportation system operations, including safety and congestion, both on road systems and in aviation, have been little studied to date.

Future characteristics of society, such as land-use patterns, demographics, and the use of information technology to alter transportation patterns, and possible changes to the very nature of future transportation systems themselves all create uncertainty in evaluating climate impacts on the nation’s transportation networks. These societal changes will probably occur gradually, however, allowing the transportation systems to adapt. Adaptation can significantly ameliorate impacts on the transportation sector; however, evaluation of adaptation costs and strategies for the transportation sector is at a relatively early stage.

Assessment of confidence based on evidence

Confidence is high that transportation systems will be affected by climate change, given current climate projections, particularly regarding sea level rise and extreme weather events.

Confidence Level

Very High

Strong evidence (established theory, multiple sources, consistent results, well documented and accepted methods, etc.), high consensus

High

Moderate evidence (several sources, some consistency, methods vary and/or documentation limited, etc.), medium consensus

Medium

Suggestive evidence (a few sources, limited consistency, models incomplete, methods emerging, etc.), competing schools of thought

Low

Inconclusive evidence (limited sources, extrapolations, inconsistent findings, poor documentation and/or methods not tested, etc.), disagreement or lack of opinions among experts

Reliability and Capacity at Risk

Global climate change has both gradual and extreme event implications. A gradually warming climate will accelerate asphalt deterioration and cause buckling of pavements and rail lines.3 Streamflows based on increasingly more frequent and intense rainfall instead of slower snowmelt could increase the likelihood of bridge damage from faster-flowing streams.13 However, less snow in some areas will reduce snow removal costs and extend construction seasons. Shifts in agricultural production patterns will necessitate changes in transportation routes and modes.14

Climate models project that extreme heat and heat waves will become more intense, longer lasting, and more frequent (Ch. 2: Our Changing Climate). By 2080-2100, average temperatures are expected to increase by 3°F to 6°F for the continental United States, assuming emissions reductions from current trends (B1 scenario), while continued increases in emissions (A2 scenario) would lead to an increase in average temperatures ranging from 5°F in Florida to 9°F in the upper Midwest.15

The impact on transportation systems not designed for such extreme temperatures would be severe. At higher temperatures, expansion joints on bridges and highways are stressed and some asphalt pavements deteriorate more rapidly.16 Rail track stresses and track buckling will increase.3,4 High air temperatures can affect aircraft performance; lift-off limits at hot-weather and high-altitude airports will reduce aircraft operations.9

Construction crews may have to operate on altered time schedules to avoid the heat of the day, with greater safety risks for workers.17 The construction season may lengthen in many localities. Similarly, higher temperatures (and precipitation changes) are likely to affect transit ridership, bicycling, and walking.3,18,19

Figure 5.1: Possible Future Flood Depths in Mobile, AL with Rising Sea Level Possible Future Flood Depths in Mobile, AL with Rising Sea Level Details/Download

Climate change is most pronounced at high northern latitudes. Alaska has experienced a 3°F rise in average temperatures since 1949,20 double the rest of the country. Winter temperatures have risen by 6°F.20 On the North Slope, sea ice formerly provided protection to the shoreline against strong fall/winter winds and storms (see Ch. 12: Indigenous Peoples). Retreating ice reduces this protection, eroding the shoreline and endangering coastal villages. Thawing permafrost is causing pavement, runway, rail, and pipeline displacements, creating problems for operation and maintenance, and requiring reconstruction of key facilities.

Arctic warming is also projected to allow the seasonal opening of the Northwest Passage to freight shipment.10 Global climate projections to 2100 show extensive open water areas during the summer around the Arctic basin. Retreat of Arctic sea ice has been observed in all seasons over the past five decades, with the most prominent retreat in summer.10 This has allowed a limited number of freighters, cruise ships, and smaller vessels to traverse the Northwest Passage for several years.

Thawing Alaska

Permafrost – soil saturated with frozen water – is a key feature of the Alaskan landscape. Frozen permafrost is a suitable base for transportation infrastructure such as roads and airfields. In rapidly warming Alaska, however, as permafrost thaws into mud, road shoulders slump, highway cuts slide, and runways sink. Alaska currently spends an extra $10 million per year repairing permafrost damage.21

A recent study, which examined potential climate damage to Alaskan public infrastructure using results from three different climate models,22 considered 253 airports, 853 bridges, 131 harbors, 819 miles of railroad, 4,576 miles of paved road, and 5,000 miles of unpaved road that could be affected by climate change. The present value of additional public infrastructure costs due to climate change impacts was estimated at $5.6 to $7.6 billion through 2080, or 10% to 12% of total public infrastructure costs in Alaska. These costs might be reduced by 40% with strong adaptation actions.22

Key Message 2: Coastal Impacts

Sea level rise, coupled with storm surge, will continue to increase the risk of major coastal impacts on transportation infrastructure, including both temporary and permanent flooding of airports, ports and harbors, roads, rail lines, tunnels, and bridges.

Supporting Evidence
close

Supporting Evidence

Key Message Process:

In developing key messages, the chapter author team engaged, via teleconference, in multiple technical discussions from January through May 2012 as they reviewed numerous peer reviewed publications. Technical input reports (21) on a wide range of topics were also received and reviewed as part of the Federal Register Notice solicitation for public input. The author team’s review included a foundational Technical Input Report for the National Climate Assessment, “Climate Impacts and U.S. Transportation.”8 Other published literature and professional judgment were also considered as the chapter key messages were developed. The chapter author team met in St. Louis, MO, in April 2012 for expert deliberation and finalization of key messages.

Description of evidence base

Estimates of global sea level rise are documented in Ch. 2: Our Changing Climate, Key Message 10 of this report.

The prospective impact of sea level rise and storm surge on transportation systems is illustrated by the impact of recent hurricanes on U.S. coastlines. In addition, research on impacts of sea level rise and storm surge on transportation assets in particular regions of the United States demonstrate the potential for major coastal impacts (for example, CCSP 2008, Rosenzweig et al. 2011, and Suarez et al. 20055,12,6). Note that most existing literature on storm surge and sea level rise impacts on transportation systems is based on a global sea level rise of less than one meter (about 3 feet). The most recent projections include a potentially greater rise in global sea level (Ch. 2: Our Changing Climate, Key Message 10).

In addition, the key message and supporting text summarize extensive evidence documented in “Climate Impacts and U.S. Transportation.”8

New information and remaining uncertainties

As noted above, new estimates of global sea level rise have overtaken most of the existing literature on transportation and sea level rise in the United States. In addition, it is not clear that the existing transportation literature reflects recent USGS work on interactions between sea level rise, wave action, and local geology.11

New global sea level rise estimates will enable the development of new regional estimates, as well as revision of regional coastal erosion and flood modeling. Such smaller scale estimates are important because transportation and other infrastructure impacts must necessarily be studied in a local context.

Generally speaking, modeling of sea level rise impacts using existing USGS National Elevation Dataset (NED) data has well-understood limitations. Since NED data is freely and easily available, it is often used for preliminary modeling. More accurate and more recent elevation data may be captured via LIDAR campaigns, and this data collection effort will be necessary for accurate understanding of regional and local sea level rise and storm surge impacts.7

Accurate understanding of transportation impacts is specific to particular infrastructure elements, so detailed inventories of local and regional infrastructure must be combined with detailed and accurate elevation data and the best available predictions of local sea level rise and storm surge. Therefore, national assessments of sea level rise must be built on detailed local and regional assessments.

Improved modeling is needed on the interactions among sea level rise, storm surge, tidal movement, and wave action to get a better understanding of the dynamics of the phenomena.

Assessment of confidence based on evidence

The authors have high confidence sea levels are rising and storm surge on top of these higher sea levels pose risks to coastal transportation infrastructure.

Confidence Level

Very High

Strong evidence (established theory, multiple sources, consistent results, well documented and accepted methods, etc.), high consensus

High

Moderate evidence (several sources, some consistency, methods vary and/or documentation limited, etc.), medium consensus

Medium

Suggestive evidence (a few sources, limited consistency, models incomplete, methods emerging, etc.), competing schools of thought

Low

Inconclusive evidence (limited sources, extrapolations, inconsistent findings, poor documentation and/or methods not tested, etc.), disagreement or lack of opinions among experts

Coastal Impacts

The transportation impacts of rising global sea level, which is expected to continue to rise by an additional 1 to 4 feet by 2100 (see also Ch. 2: Our Changing Climate, Key Message 10),24 will vary widely by location and geography. When sea level rise is coupled with intense storms, the resulting storm surges will be greater, extend farther inland, and cause more extensive damage. Relative sea level rise will be greater along some coasts (such as Louisiana, Texas, and parts of the Chesapeake Bay), and this will have significant effects on transportation infrastructure, even without the coupling with storms, due to regional land subsidence (land sinking or settling) (Ch. 25: Coasts). Ports and harbors will need to be reconfigured to accommodate higher seas. Many of the nation’s largest ports are along the Gulf Coast, which is especially vulnerable due to a combination of sea level rise, storm surges, erosion, and land subsidence.5 Two additional impacts for ports include 1) as sea level rises, bridge clearance may not be adequate to allow safe passage of large vessels; 2) even if the elevation of port facilities is adequate, any main access road that is not elevated will become more frequently inundated, thus affecting port operations. In 2011, the United States imported 45% of all oil consumed, and 56% of those imports passed through Gulf Coast ports.25

Figure 5.2: Airports Vulnerable to Storm Surge

Airports Vulnerable to Storm Surge

1

San Francisco International

5.4 feet

2

Oakland International

5.6 feet

3

John F. Kennedy International

11.3 feet

4

LaGuardia

6.7 feet

5

Philadelphia International

8.3 feet

6

Newark Liberty International

8.6 feet

7

Ronald Reagan Washington National

10.3 feet

8

Louis Armstrong International

-1.7 feet

9

Tampa International

10.6 feet

10

Ft. Lauderdale International

5.2 feet

11

Miami International

7.4 feet

12

Isla Grande San Juan, Puerto Rico

6.8 feet

13

Honolulu International

7.7 feet

Figure 5.2: Thirteen of the nation’s 47 largest airports have at least one runway with an elevation within the reach of moderate to high storm surge. Sea level rise will pose a threat to low-lying infrastructure, such as the airports shown here. (Data from Federal Aviation Administration 201223).

Details/Download

More frequent disruptions and damage to roads, tracks, runways, and navigation channels are projected in coastal areas beyond the Gulf Coast. Thirteen of the nation’s 47 largest airports have at least one runway with an elevation within 12 feet of current sea levels.23 Most ocean-going ports are in low-lying coastal areas, including three of the most important for imports and exports: Los Angeles/Long Beach (which handles 31% of the U.S. port container movements) and the Port of South Louisiana and the Port of Galveston/Houston (which combined handle 25% of the tonnage handled by U.S. ports).26 Extreme floods and storms associated with climate change will lead to increased movement of sediment and buildup of sandy formations in channels. For example, many federally maintained navigation channels have deteriorated in recent years to dimensions less than those authorized, in part due to floods and storms, which resulted in reduced levels of service that affect navigation safety and reliability.27 Channels that are not well maintained and have less sedimentation storage volume will thus be more vulnerable to significant, abrupt losses in navigation service levels. Additional channel storage capacity that may be created by sea level rise will also increase water depths and increase sedimentation in some channels. (See Ch. 25: Coasts for additional discussion of coastal transportation impacts.)

Key Message 3: Weather Disruptions

Extreme weather events currently disrupt transportation networks in all areas of the country; projections indicate that such disruptions will increase.

Supporting Evidence
close

Supporting Evidence

Key Message Process:

In developing key messages, the chapter author team engaged, via teleconference, in multiple technical discussions from January through May 2012 as they reviewed numerous peer reviewed publications. Technical input reports (21) on a wide range of topics were also received and reviewed as part of the Federal Register Notice solicitation for public input. The author team’s review included a foundational Technical Input Report for the National Climate Assessment, “Climate Impacts and U.S. Transportation.”8 Other published literature and professional judgment were also considered as the chapter key messages were developed. The chapter author team met in St. Louis, MO, in April 2012 for expert deliberation and finalization of key messages.

Description of evidence base

The key message and supporting text summarize extensive evidence documented in “Climate Impacts and U.S. Transportation.”8

Specific regional climate impacts can be identified in each NCA region of the country. Specific climate impacts on transportation by region include:

In Alaska, rising temperatures cause permafrost to melt, causing damage to roadbeds, airfields, pipelines, and other transportation infrastructure.21

In the Northeast, the Chesapeake region is likely to experience particularly severe local sea level rise due to geologic subsidence,7 and increased precipitation generally (see Ch. 2: Our Changing Climate, Key Message 5, and Ch.16: Northeast), along with an increased incidence of extreme weather events. The presence of large populations with associated transportation systems in coastal areas increases the potential impacts of sea level rise, storm surge, and precipitation-induced flooding.

The Southeast is subject to the interacting effects of sea level rise, increased precipitation, and other extreme events. The Southeast includes Virginia, so it shares the threat of regional sea level rise in the Chesapeake. In Louisiana, climate change poses a significant threat to transportation infrastructure of national significance.5

Midwest transportation infrastructure is subject to changing water levels on the Great Lakes.28 Barge traffic disruptions, due to flooding or drought on the Mississippi/Missouri/Ohio river system, might be induced by changes in precipitation patterns.

A major concern in the Southwest is that declining precipitation (see Ch. 2: Our Changing Climate, Key Message 5) may induce changes in the economy and society that will affect the transportation systems that serve this region. In the Southwest, rail and highway systems may be exposed to increased heat damage from the higher temperatures. San Francisco Bay, which encompasses two major airports and numerous key transportation links, is at risk for sea level rise and storm surge.29

Much of the economy of the Northwest is built around electricity and irrigation from a network of dams. The performance of this system may be affected by changing precipitation patterns, with potential consequences for agriculture and industry, and, consequently for transportation systems. In addition, the Seattle area may be affected by sea level rise.30

Many relevant and recent climate data and models predict more intense precipitation events in much of the U.S., especially the Great Plains, Midwest, Northeast, and Southeast, with decreased precipitation in parts of the Southwest and Southeast (see Ch. 2: Our Changing Climate, Key Message 5).

New information and remaining uncertainties

Recent data clearly show – and climate models further substantiate – an increase in the intensity of precipitation events throughout much of the U.S.

There is a need for a better definition of the magnitude of increased storm intensity so that accurate return frequency curves can be established.

New regional climate model data from CMIP5 will have a significant impact on regional impact assessments.

Climate and impact data desired by transportation planners may be different from the projections generated by regional climate models. This presents a number of challenges:

Regional scale transportation impacts are often determined by flood risk and by water flows in rivers and streams. Flooding is, of course, linked to precipitation, but the linkage between precipitation and hydrology is very complex. Precipitation, as projected by climate models, is often difficult to convert into predictions of future flooding, which is what infrastructure designers need.

Similarly, an ice storm would be an extreme event for a transportation planner, but the frequency of ice storms has not yet been derived from climate models. More generally, improved methods of deriving the frequency of infrastructure-affecting weather events from regional climate models may be helpful in assessing climate impacts on transportation systems.

There are uncertainties associated with the correlation between a warming climate and increased hurricane intensity.

In regions likely to see decreased precipitation, especially those areas subject to drought, stronger correlations to fire threat and lowered water levels in major waterways are needed as projections of climate models.

Planning tools and models can present a step-by-step process for connecting the risk of impact with specific planning strategies such as assessing the vulnerability of existing and proposed infrastructure and then identifying key adaptation practices to address the risk.

Assessment of confidence based on evidence

Given the evidence base and remaining uncertainties, confidence is high that extreme weather events will affect transportation in all areas of the country.

Confidence Level

Very High

Strong evidence (established theory, multiple sources, consistent results, well documented and accepted methods, etc.), high consensus

High

Moderate evidence (several sources, some consistency, methods vary and/or documentation limited, etc.), medium consensus

Medium

Suggestive evidence (a few sources, limited consistency, models incomplete, methods emerging, etc.), competing schools of thought

Low

Inconclusive evidence (limited sources, extrapolations, inconsistent findings, poor documentation and/or methods not tested, etc.), disagreement or lack of opinions among experts

Weather Disruptions

Changes in precipitation patterns, particularly more extreme precipitation events and drought, will affect transportation systems across the country. Delays caused by severe storms disrupt almost all types of transportation. Storm drainage systems for highways, tunnels, airports, and city streets could prove inadequate, resulting in localized flooding. Bridge piers are subject to scour as runoff increases stream and river flows, potentially weakening bridge foundations. Severe storms will disrupt highway traffic, leading to more accidents and delays. More airline traffic will be delayed or canceled.

Inland waterways may well experience greater floods, with high flow velocities that are unsafe for navigation and that cause channels to shut down intermittently. Numerous studies indicate increasing severity and frequency of flooding throughout much of the Mississippi and Missouri River Basins.33,34 Increases in flood risk reflect both changing precipitation and changing land-use patterns.35 In the Upper Mississippi/Missouri Rivers, there have been two 300- to 500-year floods over the past 20 years.36 Drought increases the probability of wildfires, which affect visibility severely enough to close roads and airports. Drought can lower vessel drafts on navigable rivers and associated lock and dam pools. On the other hand, less ice formation on navigable waterways has the potential to increase seasonal windows for passage of navigation.

Figure 5.3: Gulf Coast Transportation Hubs at Risk Gulf Coast Transportation Hubs at Risk Details/Download

The frequency of the strongest hurricanes (Category 4 and 5) in the Atlantic is expected to increase (see Ch. 2: Our Changing Climate, Key Message 8). As hurricanes approach landfall, they create storm surge, which carries water farther inland. The resulting flooding, wind damage, and bridge destruction disrupts virtually all transportation systems in the affected area. Many of the nation’s military installations are in areas that are vulnerable to extreme weather events, such as naval bases located in hurricane-prone zones.

Hurricane Sandy

On October 29, 2012, Hurricane Sandy dealt the transportation systems of New Jersey and New York and environs a massive blow (See also Ch.16: Northeast, “Hurricane Vulnerability”; Ch. 11: Urban, “Hurricane Sandy”). The damages from Sandy are indicative of what powerful tropical storms and higher sea levels could bring on a more frequent basis in the future and were very much in line with vulnerability assessments conducted over the past four years.37,38,39,40 All tunnels and most bridges leading into New York City were closed during the storm. Storm tides of up to 14 feet41,42 flooded the Queens Midtown, Holland, and Carey (Brooklyn Battery) tunnels, which remained closed for at least one week (two weeks for the Carey Tunnel) while floodwaters were being pumped out and power restored. The three major airports (Kennedy, Newark, and LaGuardia) flooded, with LaGuardia absorbing the worst impact and closing for three days.43

Almost 7.5 million passengers per day ride the New York City subways and buses.44 Much of the New York City subway system below 34th Street was flooded, including all seven tunnels under the East River to Brooklyn and Queens. In addition to removing the floodwaters, all electrical signaling and power systems (the third rails) had to be cleaned, inspected, and repaired. Service on most Lower Manhattan subways was suspended for at least one week,32 as was the PATH system to New Jersey.45 Commuter rail service to New Jersey, Long Island, and northern suburbs, with more than 500,000 passengers per day,44 was similarly affected for days or weeks with flooded tunnels, downed trees and large debris on tracks, and loss of electrical power.46 In addition, miles of local roads, streets, underpasses, parking garages, and bridges flooded and/or were badly damaged in the region, and an estimated 230,000 parked vehicles47 sustained water damage. Flooded roadways prevented the New York Fire Department from responding to a fire that destroyed more than 100 homes in Brooklyn’s Breezy Point neighborhood.48

Figure 5.4: Hurricane Sandy Causes Flooding in New York City Subway Stations Hurricane Sandy Causes Flooding in New York City Subway Stations Details/Download

Hurricane Sandy’s storm surge produced nearly four feet of floodwaters throughout the Port of New York and New Jersey, damaging electrical systems, highways, rail track, and port cargo; displacing hundreds of shipping containers; and causing ships to run aground.49 Floating debris, wrecks, and obstructions in the channel had to be cleared before the Port was able to reopen to incoming vessels within a week.50 Pleasure boats were damaged at marinas throughout the region. On a positive note, the vulnerability analyses prepared by the metropolitan New York authorities and referenced above provided a framework for efforts to control the damage and restore service more rapidly. Noteworthy are the efforts of the Metropolitan Transportation Authority to protect vital electrical systems and restore subway service to much of New York within four days.

The impacts of this extraordinary storm on one of the nation’s most important transportation nodes were felt across the country. Airline schedules throughout the United States and internationally were snarled; Amtrak rail service along the East Coast and as far away as Buffalo and Montreal was curtailed; and freight shipments in and out of the hurricane impact zone were delayed. The resultant direct costs to the community and indirect costs to the economy will undoubtedly rise into the tens of billions of dollars (See also Ch. 11: Urban, “Hurricane Sandy”).

Risks and Consequences

Risk is a function of both likelihood of impact and the consequences of that impact. Table 5.1 is an illustrative application of a risk matrix adapted from the Port Authority of New York and New Jersey. As shown, different types of climate-related incidents/events can have associated with them a likelihood of occurrence and a magnitude of the consequences if the incident does occur.

In assessing consequences, the intensity of system use, as well as the existence or lack of alternative routes, must be taken into account. Disabling a transportation facility can have ripple effects across a network, with trunk (main) lines and hubs having the most widespread impacts.51

Table 5.1: Illustrative Risks of Climate-related Impacts

close
  Likelihood of Occurence
Magnitude of Consequences Low Medium High Virtually Certain
High Subway and tunnel flooding Increased widespread flooding of transportation facilities Major localized flooding disrupts transportation systems Inundation of coastal assets due to storm surge
Medium Increased rock/mud slides blocking road and rail facilities Train derailment due to rail buckling Increased disruption of barge traffic due to flooding Short-term road flooding and blocked culverts due to extreme events
Low Lower visibility from wildfires due to drought conditions Northward shift of agricultural production places more demand and stress on roads and systems not prepared for higher volumes Pavement heaving and reduced pavement life due to high temperatures Inundation of local roads due to sea level rise
Positive (beneficial) Reduced flight cancellations due to fewer blizzards Reduced maintenance costs for highways and airports due to warmer winters Reduced Great Lakes freezing, leading to longer shipping season Longer seasonal opening of Northwest Passage

Table 5.1: Note: Table 5.1 relates to overall national expectations based on Angel and Kunkel 201028 and as postulated by chapter authors. This kind of matrix is likely to be most valuable and accurate if used at the state/regional/local levels. (Source: Matrix format adapted from McLaughlin et al. 201151).

Any comprehensive assessment of the consequences of climate change would need to encompass the broad array of factors that influence the nation’s transportation system, and consider changes in population, society, technology, prices, regulation, and the economy that eventually affect transportation system performance.52 For example, the trend in recent years in the U.S. economy of adopting just-in-time logistics increases the vulnerability of businesses to day-to-day disruptions caused by weather and flooding.

Key Message 4: Costs and Adaptation Options

Climate change impacts will increase the total costs to the nation’s transportation systems and their users, but these impacts can be reduced through rerouting, mode change, and a wide range of adaptive actions.

Supporting Evidence
close

Supporting Evidence

Key Message Process:

In developing key messages, the chapter author team engaged, via teleconference, in multiple technical discussions from January through May 2012 as they reviewed numerous peer reviewed publications. Technical input reports (21) on a wide range of topics were also received and reviewed as part of the Federal Register Notice solicitation for public input. The author team’s review included a foundational Technical Input Report for the National Climate Assessment, “Climate Impacts and U.S. Transportation.”8 Other published literature and professional judgment were also considered as the chapter key messages were developed. The chapter author team met in St. Louis, MO, in April 2012 for expert deliberation and finalization of key messages.

Description of evidence base

The economic cost of climate change to the transportation sector has been little studied. However, there is substantial evidence that costs will be significant. A recent study of climate change in New York indicated that a storm surge severe enough to flood Manhattan tunnels might cost as much as $100 billion.6 The actual experience of Hurricane Sandy, where multiple tunnels were flooded, attests to the scale of the costs and disruption that attend an event of this magnitude (See also Ch. 11: Urban; Box on Hurricane Sandy). A study of the risk to specific infrastructure elements in Alaska22 estimated the net present value of the extra cost from climate change at $2 to $4 billion through 2030, and $4 to $8 billion through 2080.

The indirect evidence for significant costs from climate change impacts begin with the consequences of recent hurricanes, particularly on the Eastern seaboard, where Hurricane Irene, a rather minor storm, produced unexpectedly heavy infrastructure damage from heavy rains.53 The economic cost of infrastructure damage is often greater than the cost of repairing or replacing infrastructure.

In addition, a recent study of on-road congestion estimates the annual cost of highway congestion at about $100 billion,54 and the Federal Highway Administration estimates that weather accounts for about 15% of total delay.55 Similarly, a recent study of aviation congestion indicates that the annual cost of airline delay is about $33 billion56 and that weather accounts for more than a third of airline delays. There is a strong circumstantial case to be made that increased frequency of extreme events (as defined by climate scientists) will produce increased traffic and aviation delays. Given the scale of current costs, even small changes in delay can have substantial economic costs.

There is little published material on transportation adaptation costs and benefits in the literature, in part because “adaptation” is an abstraction (see Ch. 28: Adaptation). Climate change is statistical weather, and manifests itself as a change in the frequency of events that would still occur (but with lower frequency) in the absence of climate change. Transportation agencies decide to protect (or not) specific pieces of infrastructure based on a range of considerations, including age and condition, extent of current and future usage, and cost of protection, as well as changing weather patterns. The authors, however, are aware, that transportation systems have always been required to adapt to changing conditions, and that, in general, it is almost always far less expensive to protect useful infrastructure than to wait for it to collapse. This professional experience, based on examination of multitudes of individual engineering studies, is the basis for the conclusion in this report (for example, Caltrans Climate Change Workshop 2011, CCSP 2008, and Meyer 20085,2,57).

There are numerous examples of actions taken by state and local governments to enhance resilience and reduce climate impact costs on transportation, including land-use planning to discourage development in vulnerable areas, establishment of design guidelines to reduce vulnerability to sea level rise, use of effective stormwater management techniques, and coordinated emergency response systems.1,57

New information and remaining uncertainties

There is relatively little information on the costs of climate change in the transportation sector, and less on the benefits of adaptation. Much of the available research is focused on the costs of replacing assets that are affected by extreme weather events, with far less effort devoted to both longer-term impacts of climate change on transportation systems (such as inundation of coastal roads due to sea level rise) and to the broader effects of disrupted facilities on network operations or on the community, for example, rerouting of traffic around bottlenecks or evacuation of sensitive populations from vulnerable areas.

Calculating climate impact and adaptation costs and benefits is an exceptionally complex problem, particularly at high levels of aggregation, since both costs and benefits accrue based on a multitude of location-specific events. In addition, all of the methodological issues that are confronted by any long-term forecasting exercise are present. The forecasting problem may be more manageable at the local and regional scales at which most transportation decisions are usually made.

Assessment of confidence based on evidence

The authors have high confidence that climate impacts will be costly to the transportation sector, but are far less confident in assessing the exact magnitude of costs, based on the available evidence and their experience. The authors also have high confidence, based upon their experience, that costs may be significantly reduced by adaptation action, though, as noted, the magnitude of such potential reductions on a national scale would be difficult to determine.

Confidence Level

Very High

Strong evidence (established theory, multiple sources, consistent results, well documented and accepted methods, etc.), high consensus

High

Moderate evidence (several sources, some consistency, methods vary and/or documentation limited, etc.), medium consensus

Medium

Suggestive evidence (a few sources, limited consistency, models incomplete, methods emerging, etc.), competing schools of thought

Low

Inconclusive evidence (limited sources, extrapolations, inconsistent findings, poor documentation and/or methods not tested, etc.), disagreement or lack of opinions among experts

Costs and Adaptation Options

Adaptation strategies can be employed to reduce the impact of climate change related events and the resulting consequences (see Ch. 28: Adaptation). Consideration of adaptation strategies in the transportation sector is especially important in the following five areas:

  • Transportation and land-use planning: deciding what infrastructure to build and where to build it, as well as planning for vulnerable areas of the community and impacts on specific population groups.
  • Vulnerability and risk assessment: identifying existing vulnerable facilities and systems, together with the expected consequences.
  • New infrastructure design: adapting new infrastructure designs that anticipate changing environmental and operational conditions.
  • Asset management: adapting existing infrastructure and operations that respond to current and anticipated conditions, including changed maintenance practices and retrofits.
  • Emergency response: anticipating expected disruptions from extreme weather events, and developing emergency response capability.
Figure 5.5: Role of Adaptive Strategies and Tactics in Reducing Impacts and Consequences Role of Adaptive Strategies and Tactics in Reducing Impacts and Consequences Details/Download

Adaptation takes place at multiple levels, from individual households and private businesses to federal, state, and local governments. The impacts associated with climate change are not new, since flooding, storm surge, and extreme heat have long been challenges. What is new is the changing frequency, intensity, and location/geography of impacts and hazards

Responding effectively to present and future environmental challenges enhances the resilience of communities. Examples include improvements in storm water management, coastal zone management, and coastal evacuation plans.

At the national level, the transportation network has some capability to adjust to climate-related disruptions due to the presence of network redundancy – multiple routes are often possible for long-distance travel, and more than one mode of transportation may be used for travel. However, in some cases, only one major route connects major destinations, such as Interstate 5 between Seattle and San Francisco; movements along such links are particularly vulnerable to disruption.

Winter Storm-Related Closures of I-5 and I-90 in Washington State, 2007–2008

In December 2007, heavy rainfall west of I-5, combined with melting snow from the mountains, created extremely high floodwaters in western Washington State. Six-hour rainfall amounts were near a 100-year event for areas in Southwest Washington. High winds, heavy rains, mudslides, and falling trees made travel unsafe on highways. Downed power lines blocked roads, and, in many urban areas, rainwater overwhelmed drainage systems and flooded roadways.

The combined economic impact in the I-5 and I-90 corridors was estimated at almost $75 million, of which some $47 million was associated with the I-5 disruption and $28 million with the I-90 corridor. Estimated highway damage from the winter storm was $18 million for state routes and another $39 million for city and county roads.58

Disruptions to the nation’s inland water system from floods or droughts can, and has, totally disrupted barge traffic. Severe droughts throughout the upper Midwest in 2012 reduced flows in the Missouri and Mississippi Rivers to near record low levels, disrupting barge traffic. While alternative modes, such as rail and truck, may alleviate some of these disruptions, it is impractical to shift major product shipments such as Midwest grain to other modes of transportation – at least in the near term.8

While extreme weather events will continue to cause flight cancellations and delays, many weather delays from non-extreme events are compounded by existing inadequacies in the current national air traffic management system.59 Improvements in the air traffic system, such as those anticipated in the FAA’s NextGEN (www.faa.gov/nextgen/), should reduce weather-related delays.

At the state and local level, there is less resilience to be gained by alternative routing, and impacts may be more intense. For example, significant local and regional disruption and economic costs could result from the flooding of assets as diverse as New York’s subways, Iowa’s roads, San Francisco’s airports, and Vermont’s bridges.

Climate change is one of many factors, and an increasingly important one, that many state, regional, and local agencies are considering as they plan for new and rehabilitated facilities. By incorporating climate change routinely into the planning process, governments can reduce the vulnerability to climate change impacts and take actions that enhance the resilience of the transportation system to adverse weather conditions. Governments at various levels are already taking action, as described below.

Land-use planning can reduce risk by avoiding new development in flood-prone areas, conserving open space to enhance drainage, and relocating or abandoning structures or roads that have experienced repeated flooding. The National Flood Insurance Program encourages buyouts of repetitive loss structures and preservation of open space by reducing flood insurance rates for communities that adopt these practices.

An important step in devising an adaptation plan is to assess vulnerabilities (Ch. 26: Decision Support; Ch. 28: Adaptation). The Federal Highway Administration funded pilot projects in five coastal states to test a conceptual framework for evaluating risk.55 The framework identifies transportation assets, evaluates the likelihood of impact on specific assets, and assesses the seriousness of such impacts.

Several state and local governments have conducted additional vulnerability assessments that identify potential impacts to transportation systems, especially in coastal areas. Detailed assessment work has been undertaken by New York City,37,39,40,6 California,29 Massachusetts,60 Washington,30 Florida, and Boston.61

Planning for Climate Change

Charlotte County exemplifies how local governments can incorporate aspects of climate change into transportation planning. The Metropolitan Planning Organization in Charlotte County-Punta Gorda, Florida conducted long-range scenario planning that integrated climate change projections.62 A “smart growth” scenario that concentrated growth in urban centers was compared with a “resilient growth” scenario that steered development away from areas vulnerable to sea level rise. Planners evaluated the scenarios based on projected transportation performance outcomes and selected a preferred scenario reflecting aspects of each alternative.

Non-coastal states and regions have also begun to produce vulnerability assessments. Midwestern states, including Wisconsin63 Iowa,64 and Michigan,65 have addressed increasing risk of flooded roadways and other impacts.

Transit systems are already implementing measures that reduce vulnerability to climate impacts, including rail buckling. Portland, Oregon’s transit agency has been installing expansion joints at vulnerable locations, improving reliability of rail service.3 In New York, ventilation grates are being elevated to reduce the risk of flooding.37

Transportation agencies are incorporating climate change into ongoing design activities. For example, the Alaska Department of Transportation (DOT) spends more than $10 million annually on shoreline protection, relocations, and permafrost protection for roadways (see “Thawing Alaska”).21 In May 2011, the California Department of Transportation (Caltrans) issued guidance to their staff on whether and how to incorporate sea level rise into new project designs.57

States have begun to integrate climate impacts into Transportation Asset Management, a systematic process for monitoring the conditions of roads and transit facilities.16,66 Maryland is working to prioritize assets taking sea level rise and increased storm intensity into account and is developing a tool to track assets and assess vulnerability.67 Florida DOT continually monitors conditions on roads and bridges and is developing a statewide inventory and action plan for high-risk bridges.68 Among inland states, Michigan DOT has identified a wide range of operational and asset management changes to adjust to climate change.65 Planting street trees has been shown to reduce the urban heat island effect and reduce heat stress on pavement.69,70

Effective stormwater and stream/river management can reduce the risk of flooding for transportation infrastructure. Following Tropical Storm Irene, Vermont state agencies are working on stream and river management to reduce conditions that exacerbate flooding impacts on transportation.71

Tropical Storm Irene Devastates Vermont Transportation in August 2011

In August of 2011, Vermont was inundated with rain and massive flooding from Tropical Storm Irene (see also Ch. 16: Northeast, “Hurricane Vulnerability”), closing down 146 segments of the state road system along with more than 200 bridges, and costing an estimated $175 to $200 million to rebuild state highways and bridges. An additional 2,000 or more municipal roads and nearly 1,000 culverts were damaged, and more than 200 miles of state-owned rail required repair.53

The volume of water was unprecedented, as was the power of the water in the rivers running through the state. Culverts and bridges were affected and slope stability was threatened as a result of the immense amount and power of water and subsequent flooding.

Figure 5.6: Tropical Storm Impact on Vermont Road Tropical Storm Impact on Vermont Road Details/Download

When asked about the lessons learned, the Vermont Agency of Transportation (VTrans) indicated the importance of good maintenance of riverbeds as well as roads. VTrans is working with the Vermont Agency of Natural Resources, looking upstream and downstream at the structure of the rivers, recognizing that risk reduction may involve managing rivers as much as changing bridges or roadways.

Rich Tetreault of VTrans emphasized that “Certainly we will be looking to right-size the bridges and culverts that need to be replaced … Knowing that we do not have the funds to begin wholesale rebuilding of the entire highway network to withstand future flooding, we will also enhance our ability to respond” when future flooding occurs.71

Effective asset management requires significant data and monitoring of transportation assets. Improved weather and road-condition information systems enable transportation system managers to anticipate and detect problems better and faster – enabling them to close systems if needed, alert motorists, and dispatch maintenance and snow-removal crews. As Michigan DOT has noted, an increase in lake-effect snows means that existing models used for snow and ice removal procedures are no longer reliable, requiring better monitoring and new models, as well as better roadway condition detection systems.65

Similarly, regular maintenance and cleaning of urban levee and culvert systems reduces the risk of roads and rails being inundated by flooding.

Extreme weather, such as hurricanes or intense storms, stresses transportation at precisely the time when smooth operation is critical. Effective evacuation planning, including early warning systems, coordination across jurisdictional boundaries, and creating multiple evacuation routes builds preparedness. Identifying areas with high concentrations of vulnerable and special-needs populations (including elderly, disabled, and transit-dependent groups) enhances readiness, as does identifying assets such as school buses or other transit vehicles that can be deployed for households that do not own vehicles.

References

  1. Adelsman, H., J. Ekrem, L. W. Binder, K. Cook, K. Cooper, L. M. Helbrecht, R. Jamison, J. D. Phillips, P. Pickett, C. L. Roalkvam, S. Salisbury, D. Siemann, and P. Speaks, 2012: Preparing for a Changing Climate. Washington State’s Integrated Climate Response Strategy. Publication No. 12-01-004. 203 pp., State of Washington, Department of Ecology, Olympia, WA. URL | Detail

  2. ,, 2010: Alaska’s Climate Change Strategy: Addressing Impacts in Alaska. Final Report Submitted by the Adaptation Advisory Group to the Alaska Climate Change Sub-Cabinet. 94 pp., State of Alaska, Juneau, AK. URL | Detail

  3. Angel, J. R., and K. E. Kunkel, 2010: The response of Great Lakes water levels to future climate scenarios with an emphasis on Lake Michigan-Huron. Journal of Great Lakes Research, 36, 51-58, doi:10.1016/j.jglr.2009.09.006. | Detail

  4. ,, 2009: Arctic Marine Shipping Assessment Report 2009. Arctic Council, Norwegian Chairmanship 2006-2009, Tromsø, Norway. URL | Detail

  5. Attavanich, W., B. A. McCarl, Z. Ahmedov, S. W. Fuller, and D. V. Vedenov, 2013: Effects of climate change on US grain transport. Nature Climate Change, 3, 638-643, doi:10.1038/nclimate1892. | Detail

  6. Aultman-Hall, L., D. Lane, and R. R. Lambert, 2009: Assessing impact of weather and season on pedestrian traffic volumes. Transportation Research Record: Journal of the Transportation Research Board, 2140, 35-43, doi:10.3141/2140-04. | Detail

  7. Ball, M., C. Barnhart, M. Dresner, M. Hansen, K. Neels, A. Odoni, E. Peterson, L. Sherry, A. A. Trani, and B. Zou, 2010: Total Delay Impact Study: a Comprehensive Assessment of the Costs and Impacts of Flight Delay in the United States. 91 pp., NEXTOR. URL | Detail

  8. Black, H., 2008: Unnatural disaster: Human factors in the Mississippi floods. Environmental Health Perspectives, 116, A390-393. | Detail

  9. Blake, E. S., T. B. Kimberlain, R. J. Berg, J. P. Cangialosi, and J. L. Beven, II, 2013: Tropical Cyclone Report: Hurricane Sandy. (AL182012) 22 – 29 October 2012. 157 pp., National Oceanic and Atmospheric Administration, National Hurricane Center. URL | Detail

  10. ,, 2009: The California Climate Adaptation Strategy 2009: A Report to the Governor of the State of California in response to Executive Order S-13-2008. 197 pp., California Natural Resources Agency, Sacramento, CA. URL | Detail

  11. ,, 2011: Guidance on Incorporating Sea-Level Rise: For Use in the Planning and Development of Project Initiation Documents.State government guidance report. 13 pp., California Department of Transportation, Sacramento, CA. URL | Detail

  12. ,, and , 2005: Traffic Congestion and Reliability: Trends and Advanced Strategies for Congestion Mitigation. U.S. Department of Transportation, Federal Highway Administration. URL | Detail

  13. ,, 2010: Charlotte County-Punta Gorda Long Range Transportation Plan 2035: Summary Report. Charlotte County-Punta Gorda Metropolitan Planning Organization, Punta Gorda, FL. URL | Detail

  14. ,, 2008: Impacts of Climate Change and Variability on Transportation Systems and Infrastructure: Gulf Study, Phase I. A Report by the U.S. Climate Change Science Program and the Subcommittee on Global Change Research. Final Report of Synthesis and Assessment Produ. U.S. Department of Transportation, 445 pp. URL | Detail

  15. ,, 2009: Coastal Sensitivity to Sea-Level Rise: A Focus on the Mid-Atlantic Region. A Report by the U.S. Climate Change Science Program and the Subcommittee on Global Change Research. U.S. Environmental Protection Agency, 320 pp. URL | Detail

  16. ,, 2011: A Climate of Progress: City of Boston Climate Action Plan Update 2011. 43 pp., Boston, MA. URL | Detail

  17. Criss, R. E., and E. L. Schock, 2001: Flood enhancement through flood control. Geology, 29, 875-878, doi:10.1130/0091-7613(2001). | Detail

  18. ,, 2012: Climate Impacts and U.S. Transportation: Technical Input Report for the National Climate Assessment. DOT OST/P-33. U.S. Department of Transportation. URL | Detail

  19. ,, 2012: Petroleum and Other Liquids. U.S. Department of Energy, U.S. Energy Information Administration. URL | Detail

  20. ,, 2011: Inventory of U.S. Greenhouse Gas Emissions and Sinks: 2000 – 2009. EPA 430-R-11-005. 459 pp., U.S. Environmental Protection Agency, Washington, D.C. URL | Detail

  21. ,, 2012: Federal Aviation Administration: U.S. & Territories Airport Lookup. Federal Aviation Administration. URL | Detail

  22. ,, 2009: FHWA/AASHTO Climate Change Adaptation Peer Exchange - December 2009. URL | Detail

  23. Guo, Z., N. H. M. Wilson, and A. Rahbee, 2007: Impact of weather on transit ridership in Chicago, Illinois. Transportation Research Record: Journal of the Transportation Research Board, 2034, 3-10, doi:10.3141/2034-01. | Detail

  24. Gutierrez, B. T., N. G. Plant, and R. E. Thieler, 2011: A Bayesian network to predict coastal vulnerability to sea level rise. Journal of Geophysical Research, 116, F02009, doi:10.1029/2010JF001891. | Detail

  25. Hampson, R., 2012: Breezy Point: Drowned, burned, but unbowed. USA Today,. URL | Detail

  26. Hodges, T., 2011: Flooded Bus Barns and Buckled Rails: Public Transportation and Climate Change Adaptation. FTA Report No. 0001. 128 pp., Federal Transit Administration, Office of Research, Demonstration and Innovation, U.S. Department of Transportation. URL | Detail

  27. ,, T. A. Koenig, and K. A. Karstensen, 2008: Flooding in the United States Midwest. USGS Professional Paper 1775. 64 pp., U.S. Geological Survey. URL | Detail

  28. ,, 2011: Climate Change Impacts on Iowa 2010. 33 pp., Iowa Department of Natural Resources, Des Moines, IA. URL | Detail

  29. Jacob, K., C. Rosenzweig, R. Horton, D. Major, and V. Gornitz, 2008: MTA Adaptations to Climate Change: A Categorical Imperative. 48 pp., State of New York, Metropolitan Transportation Authority, New York, NY. URL | Detail

  30. Jaroszweski, D., L. Chapman, and J. Pettis, 2010: Assessing the potential impact of climate change on transportation: The need for an interdisciplinary approach. Journal of Transport Geography, 18, 331-335, doi:10.1016/j.jtrangeo.2009.07.005. | Detail

  31. Kafalenos, R. S., K. J. Leonard, D. M. Beagan, V. R. Burkett, B. D. Keim, A. Meyers, D. T. Hunt, R. C. Hyman, M. K. Maynard, B. Fritsche, R. H. Henk, E. J. Seymour, L. E. Olson, J. R. Potter, and M. J. Savonis, 2008: Ch. 4: What are the implications of climate change and variability for Gulf Coast transportation? Impacts of Climate Change and Variability on Transportation Systems and Infrastructure: Gulf Study, Phase I. A report by the U.S. Climate Change Science Program and the Subcommittee on Global Change Research. Final Report of Synthesis and Assessment Produ, M.J. Savonis, Burkett, V.R., and Potter, J.R., Eds., U.S. Department of Transportation. URL | Detail

  32. Khelifa, A., L. Garrow, M. Higgins, and M. Meyer, 2013: Impacts of climate change on scour-vulnerable bridges: Assessment based on HYRISK. Journal of Infrastructure Systems, 19, 138-146, doi:10.1061/(ASCE)IS.1943-555X.0000109. | Detail

  33. Kulesa, G., 2003: Weather and aviation: How does weather affect the safety and operations of airports and aviation, and how does FAA work to manage weather-related effects? The Potential Impacts of Climate Change on Transportation, Summary and Discussion Papers, Federal Research Partnership Workshop, October 1-2, 2002,, U.S. Department of Transportation Center for Climate Change and Environmental Forecasting, 199-208. URL | Detail

  34. Kunkel, K. E., L. E. Stevens, S. E. Stevens, L. Sun, E. Janssen, D. Wuebbles, and J. G. Dobson, 2013: Regional Climate Trends and Scenarios for the U.S. National Climate Assessment: Part 9. Climate of the Contiguous United States. NOAA Technical Report NESDIS 142-9. 85 pp., National Oceanic and Atmospheric Administration, National Environmental Satellite, Data, and Information Service, Washington, D.C. URL | Detail

  35. Kusky, T., Q. Lei, A. Ghulam, and Y. Chen, 2009: Urbanization and changes to the Missouri River floodplain. Finding the Balance Between Floods, Flood Protection, and River Navigation., R.E. Criss and Kusky, T., Eds., Center for Environmental Sciences at Saint Louis University, 9-15. URL | Detail

  36. Larsen, P. H., S. Goldsmith, O. Smith, M. L. Wilson, K. Strzepek, P. Chinowsky, and B. Saylor, 2008: Estimating future costs for Alaska public infrastructure at risk from climate change. Global Environmental Change, 18, 442-457, doi:10.1016/j.gloenvcha.2008.03.005. URL | Detail

  37. Locke, D. H., M. J. Grove, J. W. T. Lu, A. Troy, J. P. M. O’Neil-Dunne, and B. D. Beck, 2010: Prioritizing preferable locations for increasing urban tree canopy in New York city. Cities and the Environment, 3, 1-18. URL | Detail

  38. ,, 2011: Massachusetts Climate Change Adaptation Report. 128 pp., Commonwealth of Massachusetts, Boston, MA. URL | Detail

  39. McLaughlin, B. J., S. D. Murrell, and S. DesRoches, 2011: Case study: Assessment of the vulnerability of Port Authority of NY & NJ facilities to the impacts of climate change. TD&I Congress 2011: Integrated Transportation and Development for a Better Tomorrow, doi:10.1061/41167(398)92. URL | Detail

  40. E. McPherson, G., J. R. Simpson, Q. Xiao, and C. Wu, 2011: Million trees Los Angeles canopy cover and benefit assessment. Landscape and Urban Planning, 99, 40-50, doi:10.1016/j.landurbplan.2010.08.011. | Detail

  41. Meyer, M. D., A. Amekudzi, and J. P. O’Har, 2010: Transportation asset management systems and climate change. Transportation Research Record: Journal of the Transportation Research Board, 2160, 12-20, doi:10.3141/2160-02. | Detail

  42. Meyer, M. D., 2008: Design Standards for US Transportation Infrastructure: The Implications of Climate Change. 30 pp., Transportation Research Board, National Research Council, Washington, D.C. URL | Detail

  43. ,, 2011: Climate Change Adaptation Issues in Highway Operations. TRB Webinar. Transportation Research Board, Washington, D.C. | Detail

  44. Mitchell, K. N., 2009: Depth utilization analysis for estimating economic activity supported by dredging. Terra et Aqua, 116, 22-30. URL | Detail

  45. ,, 2012: MTA Service Advisory. State of New York, Metropolitan Transportation Authority. URL | Detail

  46. ,, 2012: Subway and Bus Ridership. Metropolitan Transit Authority. URL | Detail

  47. ,, 2013: Sandy Vehicles Load Airport Runway. URL | Detail

  48. ,, 2010: Report to the Legislature. 102 pp., New York State Department of Environmental Conservation, Albany, NY. URL | Detail

  49. ,, 2011: Responding to Climate Change in New York State: The ClimAID Integrated Assessment for Effective Climate Change Adaptation in New York State. Vol. 1244C. Rosenzweig, Solecki, W., DeGaetano, A., O'Grady, M., Hassol, S., and Grabhorn, P., Eds. Blackwell Publishing, 649 pp. URL | Detail

  50. ,, 1986: Occupational Exposure to Hot Environments: Revised Criteria 1986. NIOSH Publication Number 86-113. 140 pp., Department of Health and Human Services, National Institute for Occupational Safety and Health, Washington, D.C. URL | Detail

  51. ,, 2008: Potential Impacts of Climate Change on U.S. Transportation. Special Report 290. Transportation Research Board, National Research Council, Committee on Twenty-First Century Systems Agriculture. The National Academies Press, 280 pp. URL | Detail

  52. ,, 2007: Ch. 2: What are the future demands on the surface transportation system? Transportation for Tomorrow: Report of the National Surface Transportation Policy and Revenue Study Commission,, National Surface Transportation Policy and Revenue Study Commission, 2-1 - 2-18. URL | Detail

  53. Oster, C. V., and J. Strong, 2008: Managing the Skies: Public Policy, Organization, and Financing of Air Traffic Management. Ashgate Publishing, 234 pp. | Detail

  54. Parris, A., P. Bromirski, V. Burkett, D. Cayan, M. Culver, J. Hall, R. Horton, K. Knuuti, R. Moss, J. Obeysekera, A. Sallenger, and J. Weiss, 2012: Global Sea Level Rise Scenarios for the United States National Climate Assessment. NOAA Tech Memo OAR CPO-1. 37 pp., National Oceanic and Atmospheric Administration, Silver Spring, MD. URL | Detail

  55. Peterson, T. C., M. McGuirk, T. G. Houston, A. H. Horvitz, and M. F. Wehner, 2006: Climate Variability and Change with Implications for Transportation. Potential Impacts of Climate Change on U.S. Transportation. Special Report 290. Committee on Twenty-First Century Systems Agriculture,, Transportation Research Board, National Research Council, 90. URL | Detail

  56. Radow, L. J., and L. Neudorff, 2011: Transportation adaptation’s bearing on planning, systems management, operations, and emergency response. Adapting Transportation to the Impacts of Climate Change: State of the Practice 2011, Transportation Research Circular Number E-C152. URL | Detail

  57. Rosenzweig, C., W. D. Solecki, R. Blake, M. Bowman, C. Faris, V. Gornitz, R. Horton, K. Jacob, A. LeBlanc, R. Leichenko, M. Linkin, D. Major, M. O’Grady, L. Patrick, E. Sussman, G. Yohe, and R. Zimmerman, 2011: Developing coastal adaptation to climate change in the New York City infrastructure-shed: Process, approach, tools, and strategies. Climatic Change, 106, 93-127, doi:10.1007/s10584-010-0002-8. URL | Detail

  58. Rossetti, M., 2002: Potential impacts of climate change on railroads. The Potential Impacts of Climate Change on Transportation, Summary and Discussion Papers, Federal Research Partnership Workshop, October 1-2, 2002,, U.S. Department of Transportation Center for Climate Change and Environmental Forecasting, 209-224. URL | Detail

  59. Schrank, D. L., T. J. Lomax, and B. Eisele, 2011: 2011 The Urban Mobility Report. Texas Transportation Institute, The Texas A&M University System. URL | Detail

  60. Slater, G. I., 2011: Transportation climate adaptation activities in Maryland. TRB 90th Annual Meeting (January 23-27, 2011),. | Detail

  61. Stewart, B. C., K. E. Kunkel, L. E. Stevens, L. Sun, and J. E. Walsh, 2013: Regional Climate Trends and Scenarios for the U.S. National Climate Assessment: Part 7. Climate of Alaska. NOAA Technical Report NESDIS 142-7. 60 pp. URL | Detail

  62. Suarez, P., W. Anderson, V. Mahal, and T. R. Lakshmanan, 2005: Impacts of flooding and climate change on urban transportation: A systemwide performance assessment of the Boston Metro Area. Transportation Research Part D: Transport and Environment, 10, 231-244, doi:10.1016/j.trd.2005.04.007. | Detail

  63. Tetreault, R., 2011: AASHTO Climate Brief, Interview. American Association of State Highway and Transportation Officials, Washington, D.C. | Detail

  64. ,, 2012: Assessing the Damage from Hurricane Sandy. The New York Times Company. URL | Detail

  65. ,, 2012: Port Authority Updates Conditions at Transportation Facilities. Press Release Number: 174-2012. URL | Detail

  66. ,, 2012: Port Elizabeth to Open for Business. Press Release Number: 179-2012. URL | Detail

  67. ,, 2012: Port Authority continues limited PATH service. Press release number: 189-2012. URL | Detail

  68. ,, 2012: Methodologies to Estimate the Economic Impacts of Disruptions to the Goods Movement System, National Cooperative Highway Research Program Report 732. National Academy of Sciences, Transportation Research Board, 105 pp. URL | Detail

  69. ,, 2011: Fixed assets and consumer durable goods for 1997–2010. Survey of Current Business, 91, 27-40. URL | Detail

  70. ,, 2012: The 2012 Statistical Abstract: Transportation. U.S. Census Bureau, U.S. Department of Commerce, Washington, D.C. URL | Detail

  71. ,, 2012: U.S. Army Corps of Engineers, personal communication. | Detail

  72. ,, 2012: Tropical Storm Irene: By the Numbers. Vermont Agency of National Resources. URL | Detail

  73. Vantuono, W. C., 2012: Hurricane Sandy Devastates NY/NJ area passenger rail systems. Railway Age,. URL | Detail

  74. Vedenov, D. V., S. W. Fuller, B. A. McCarl, W. Attavanich, and Z. Ahmedov, 2011: Effect of Climate Change on Crop Production Patterns With Implications to Transport Flows and Inland Waterways. 82 pp., University Transportation Center for Mobility, Texas Transportation Institute. The Texas A&M University System, College Station, Texas; Washington, D.C. URL | Detail

  75. ,, 2011: Wisconsin’s Changing Climate Impacts and Adaptation. Wisconsin Initiative on Climate Change Impacts, Nelson Institute for Environmental Studies, University of Wisconsin-Madison, Wisconsin Department of Natural Resources, Madison, WI. URL | Detail

  76. Wilbanks, T., S. Fernandez, G. Backus, P. Garcia, K. Jonietz, P. Kirshen, M. Savonis, B. Solecki, and L. Toole, 2012: Climate Change and Infrastructure, Urban Systems, and Vulnerabilities. Technical Report to the U.S. Department of Energy in Support of the National Climate Assessment. 119 pp., Oak Ridge National Laboratory. U.S. Department of Energy, Office of Science, Oak Ridge, TN. URL | Detail

  77. ,, 2008: Storm-Related Closures of I-5 and I-90: Freight Transportation Economic Impact Assessment Report, Winter 2007-2008. 34 pp., Washington State Department of Transportation, Freight Systems Division, Olympia, WA. URL | Detail

  78. Zimmerman, R., and C. Faris, 2010: Infrastructure impacts and adaptation challenges. Annals of the New York Academy of Sciences, 1196, 63-86, doi:10.1111/j.1749-6632.2009.05318.x. | Detail

The National Climate Assessment summarizes the impacts of climate change on the United States, now and in the future.

A team of more than 300 experts guided by a 60-member Federal Advisory Committee produced the report, which was extensively reviewed by the public and experts, including federal agencies and a panel of the National Academy of Sciences.

United States Global Change Research Program logo United States Global Change Research Program participating agency logos