This website is the digital version of the 2014 National Climate Assessment, produced in collaboration with the U.S. Global Change Research Program.

For the official version, please refer to the PDF in the downloads section. The downloadable PDF is the official version of the 2014 National Climate Assessment.

Credits | Site Map

Search Options

X

Search form

Top

Welcome to the National Climate Assessment

The National Climate Assessment summarizes the impacts of climate change on the United States, now and in the future.

A team of more than 300 experts guided by a 60-member Federal Advisory Committee produced the report, which was extensively reviewed by the public and experts, including federal agencies and a panel of the National Academy of Sciences.

Explore the effects of climate change
United States Global Change Research Program logo
United States Department of Agriculture logo United States Department of Commerce logo United States Department of Defense logo United States Department of Energy logo United States Department of Health and Human Services logo United States Department of the Interior logo United States Department of State logo United States Department of Transportation logo United States Environmental Protection Agency logo National Aeronautics and Space Administration logo National Science Foundation logo Smithsonian Institution logo United States Agency for International Development logo

Energy Supply and Use

Extreme weather events cause energy supply disruptions. Net electricity use is projected to rise as the increase in summer cooling needs outpaces the decrease in winter heating needs. Coastal energy facilities face growing risks.

Explore impacts to energy supply and use.

Next

Convening Lead Authors

Jan Dell, ConocoPhillips

Susan Tierney, Analysis Group Consultants

Lead Authors

Guido Franco, California Energy Commission

Richard G. Newell, Duke University

Rich Richels, Electric Power Research Institute

John Weyant, Stanford University

Thomas J. Wilbanks, Oak Ridge National Laboratory

Introduction

The U.S. energy supply system is diverse and robust in its ability to provide a secure supply of energy with only occasional interruptions. However, projected impacts of climate change will increase energy use in the summer and pose additional risks to reliable energy supply. Extreme weather events and water shortages are already interrupting energy supply, and impacts are expected to increase in the future. Most vulnerabilities and risks to energy supply and use are unique to local situations; others are national in scope.

utility workers

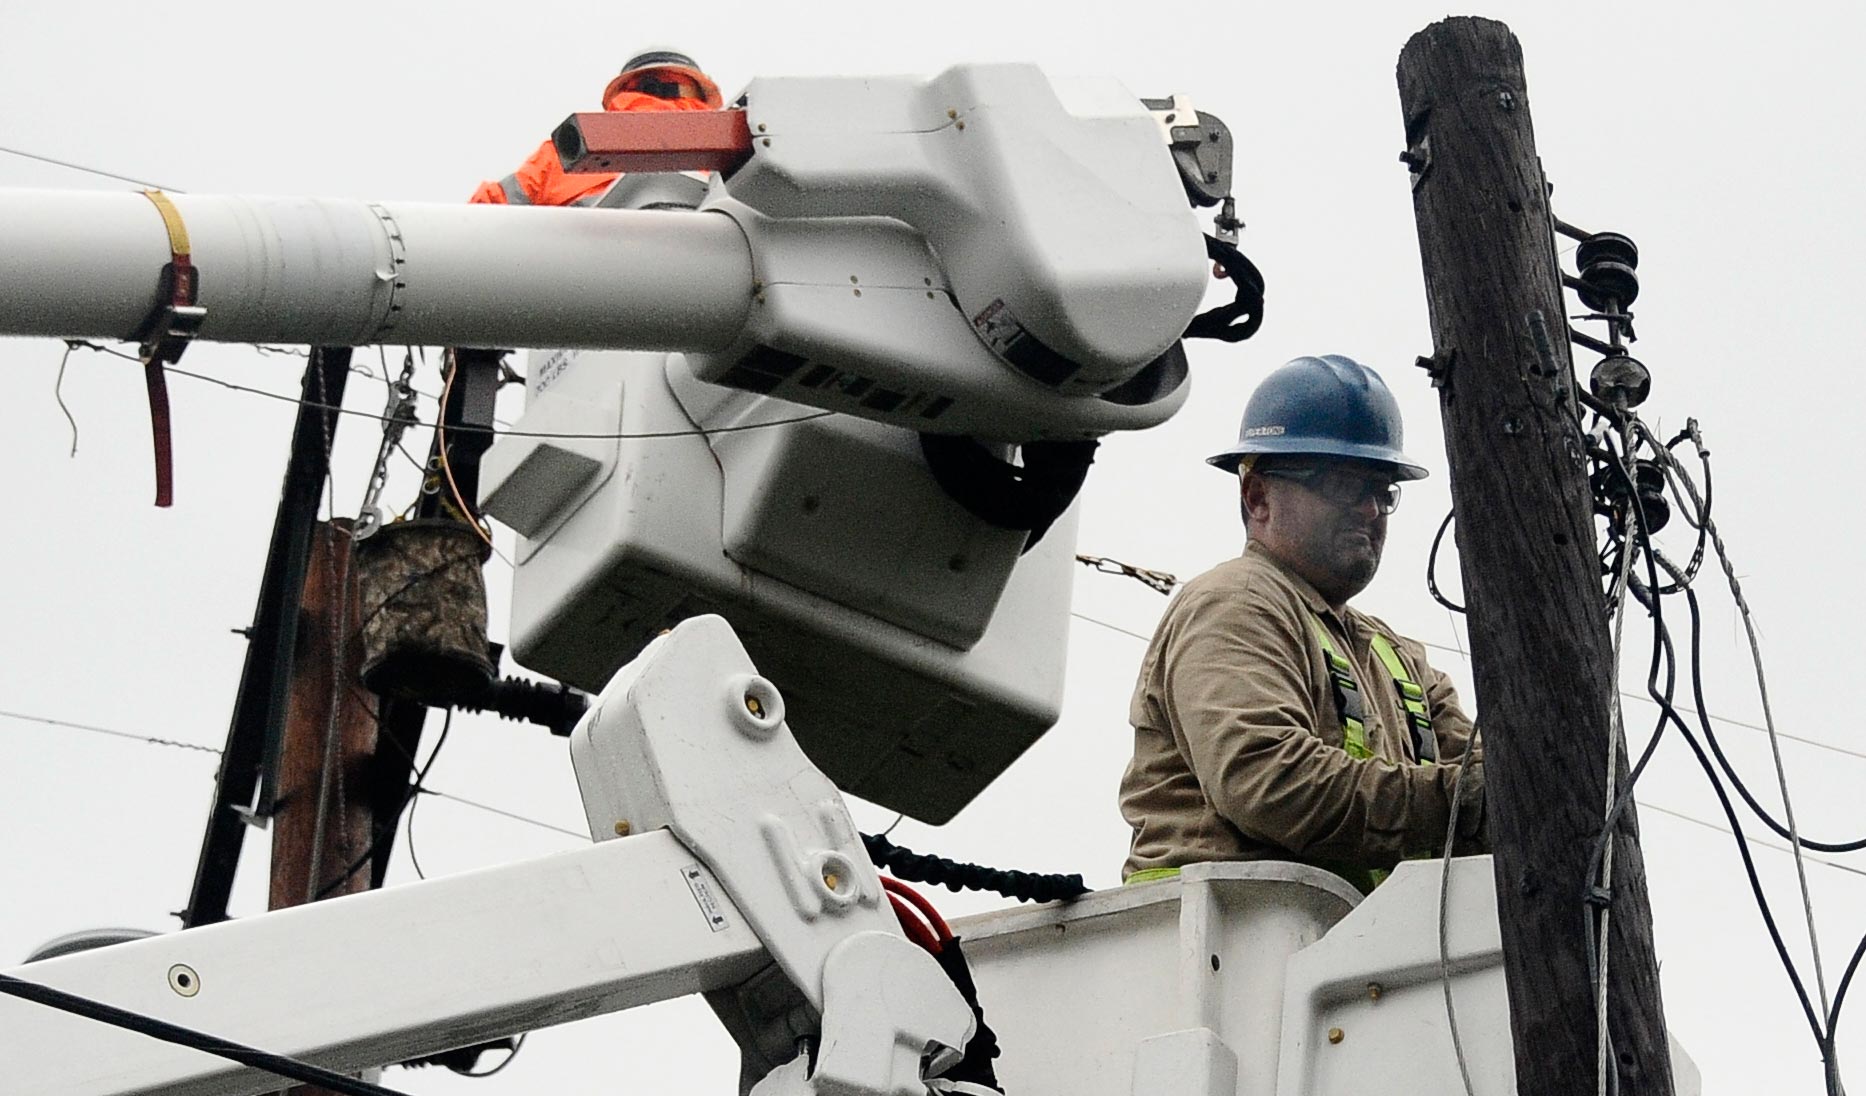
Energy infrastructure around the country has been compromised by extreme weather events

In addition to being vulnerable to the effects of climate change, electricity generation is a major source of the heat-trapping gases that contribute to climate change. Therefore, regulatory or policy efforts aimed at reducing emissions would also affect the energy supply system. See Ch. 10: Energy, Water, and Land, Key Message 2; and Ch. 27: Mitigation for more on this topic. This chapter focuses on impacts of climate change to the energy sector.

The impacts of climate change in other countries will also affect U.S. energy systems through global and regional cross-border markets and policies. Increased energy demand within global markets due to industrialization, population growth, and other factors will influence U.S. energy costs through competition for imported and exported energy products. The physical impacts of climate change on future energy systems in the 25- to 100-year timeframe will depend on how those energy systems evolve. That evolution will be driven by multiple factors, including technology innovations and carbon emission constraints.

Adaptation actions can allow energy infrastructure to adjust more readily to climate change. Many investments toward adaptation provide short-term benefits because they address current vulnerabilities as well as future risks, and thus entail “no regrets.” Such actions can include a focus on increased efficiency of energy use as well as improvements in the reliability of production and transmission of energy. The general concept of adaptation is presented in Chapter 28: Adaptation.

Key Message 1: Disruptions from Extreme Weather

Extreme weather events are affecting energy production and delivery facilities, causing supply disruptions of varying lengths and magnitudes and affecting other infrastructure that depends on energy supply. The frequency and intensity of certain types of extreme weather events are expected to change.

Supporting Evidence
close

Supporting Evidence

Process for Developing Key Messages:

The author team met bi-weekly by teleconference during the months of March through July 2012. Early in the development of key messages and a chapter outline, the authors reviewed all of the four dozen relevant technical input reports that were received in response to the Federal Register solicitation for public input. Selected authors participated in a U.S. Department of Energy (DOE) sponsored workshop on Energy Supply and Use, December 29-30, 2011 in Washington, D.C. The workshop was organized specifically to inform a DOE technical input report and this National Climate Assessment and to engage stakeholders in this process. The authors selected key messages based on the risk and likelihood of impacts, associated consequences, and available evidence. Relevance to decision support within the energy sector was also an important criterion.

The U.S. maintains extensive data on energy supply and use. The Energy Information Administration (EIA) of the U.S. Department of Energy is a primary organization in this activity, and data with quality control, quality assurance, and expert review are available through EIA Web pages (for example, EIA 2012, EIA 20131,2).

Description of evidence base

A series of NCA workshops reviewed potential influences of climate change thus far on the frequency and intensity of certain types of extreme events.3 Numerous past extreme events demonstrate damage to energy facilities and infrastructure. Data assembled and reviewed by the Federal Government summarize typical costs associated with damage to energy facilities by extreme events.4 State and regional reports as well as data provided by public utilities document specific examples.5,2,6,7

Damage to Gulf Coast energy facilities and infrastructure by Hurricanes Katrina and Rita in 2005 provides excellent examples to support this key message.8,2 Wildfire also damages transmission grids.6

The authors benefited from Agency-sponsored technical input reports summarizing relevant data and information on energy supply and use as well as urban systems and infrastructure.5,9,10 A number of other technical input reports were relevant as well. These were reviewed carefully, particularly with regard to the identification of key messages.

New information and remaining uncertainties

The information provided through a series of NCA workshops provided new (and current) evidence for influences of climate change on the frequency and intensity of extreme events. The summaries from those workshops provide succinct evidence that certain extreme events that damage energy facilities and infrastructure can be expected to increase in number and intensity with climate change (for example, Peterson et al. 20123). Documentation of damage to energy facilities and infrastructure continues to accumulate, increasing confidence in this key message.4,11

The regional and local character of extreme events varies substantially, and this variability is a source of significant uncertainty regarding the impacts of climate change and consequences in terms of damage to energy facilities by extreme events. Additionally, damage to energy infrastructure in a specific location can have far-reaching consequences for energy production and distribution, and synthesis of such indirect consequences for production and distribution does not yet support detailed projections.

Assessment of confidence based on evidence

High. There is high consensus with moderate evidence that extreme weather events associated with climate change will increase disruptions of energy infrastructure and services in some locations.

Confidence Level

Very High

Strong evidence (established theory, multiple sources, consistent results, well documented and accepted methods, etc.), high consensus

High

Moderate evidence (several sources, some consistency, methods vary and/or documentation limited, etc.), medium consensus

Medium

Suggestive evidence (a few sources, limited consistency, models incomplete, methods emerging, etc.), competing schools of thought

Low

Inconclusive evidence (limited sources, extrapolations, inconsistent findings, poor documentation and/or methods not tested, etc.), disagreement or lack of opinions among experts

Disruptions from Extreme Weather

Much of America’s energy infrastructure is vulnerable to extreme weather events. Because so many components of U.S. energy supplies – like coal, oil, and electricity – move from one area to another, extreme weather events affecting energy infrastructure in one place can lead to supply consequences elsewhere.

Climate change has begun to affect the frequency, intensity, and length of certain types of extreme weather events.12,13,14,3,15 What is considered an extreme weather or climate event varies from place to place. Observed changes across most of the U.S. include increased frequency and intensity of extreme precipitation events, sustained summer heat, and in some regions, droughts and winter storms. The frequency of cold waves has decreased (Ch. 2: Our Changing Climate).

Projected climate changes include increases in various types of extreme weather events, particularly heat waves, wildfire, longer and more intense drought, more frequent and intense very heavy precipitation events, and extreme coastal high water due to heavy-precipitation storm events coupled with sea level rise. Extreme coastal high water will increasingly disrupt infrastructure services in some locations.5 The frequency of cold waves is expected to continue decreasing. Disruptions in services in one infrastructure system (such as energy) will lead to disruptions in one or more other infrastructures (such as communications and transportation) that depend on other affected systems. Infrastructure exposed to extreme weather and also stressed by age or by demand that exceeds designed levels is particularly vulnerable (see Ch. 11: Urban).

Like much of the nation’s infrastructure affected by major weather events with estimated economic damages greater than $1 billion,4,16 U.S. energy facilities and systems, especially those located in coastal areas, are vulnerable to extreme weather events. Wind and storm surge damage by hurricanes already causes significant infrastructure losses on the Gulf Coast.

In 2005, damage to oil and gas production and delivery infrastructure by Hurricanes Katrina and Rita affected natural gas, oil, and electricity markets in most parts of the United States. 5,17 Market impacts were felt as far away as New York and New England,8,2 highlighting the significant indirect economic impacts of climate-related events that go well beyond the direct damages to energy infrastructure.

Figure 4.1: Paths of Hurricanes Katrina and Rita Relative to Oil and Gas Production Facilities Paths of Hurricanes Katrina and Rita Relative to Oil and Gas Production Facilities Details/Download

Various aspects of climate change will affect and disrupt energy distribution and energy production systems. It is projected that wildfires will affect extensive portions of California’s electricity transmission grid.6 Extreme storm surge events at high tides are expected to increase,18,19 raising the risk of inundating energy facilities such as power plants, refineries, pipelines, and transmission and distribution networks. Rail transportation lines that carry coal to power plants, which produced 42% of U.S. electricity in 2011, often follow riverbeds. More intense rainstorms can lead to river flooding that degrades or washes out nearby railroads and roadbeds, and increases in rainstorm intensity have been observed and are projected to continue.

By learning from previous events, offshore operations can be made more resilient to the impacts of hurricanes. During Hurricane Isaac in August 2012, the U.S. Bureau of Safety and Environmental Enforcement reported that oil and gas production was safely shut down and restarted within days of the event.20,21

The geographical diversification of energy sources away from hurricane-prone areas such as the Gulf of Mexico has reduced vulnerability to hurricanes. The U.S. Energy Information Administration (EIA) reports that the percentage of natural gas production from the Gulf of Mexico shifted from 20% in 2005 to 7% in 2012.22,23,24 This is due to the development of shale gas production in other parts of the United States.

Key Message 2: Climate Change and Seasonal Energy Demands

Higher summer temperatures will increase electricity use, causing higher summer peak loads, while warmer winters will decrease energy demands for heating. Net electricity use is projected to increase.

Supporting Evidence
close

Supporting Evidence

Process for Developing Key Messages:

The author team met bi-weekly by teleconference during the months of March through July 2012. Early in the development of key messages and a chapter outline, the authors reviewed all of the four dozen relevant technical input reports that were received in response to the Federal Register solicitation for public input. Selected authors participated in a U.S. Department of Energy (DOE) sponsored workshop on Energy Supply and Use, December 29-30, 2011 in Washington, D.C. The workshop was organized specifically to inform a DOE technical input report and this National Climate Assessment and to engage stakeholders in this process. The authors selected key messages based on the risk and likelihood of impacts, associated consequences, and available evidence. Relevance to decision support within the energy sector was also an important criterion.

The U.S. maintains extensive data on energy supply and use. The Energy Information Administration (EIA) of the U.S. Department of Energy is a primary organization in this activity, and data with quality control, quality assurance, and expert review are available through EIA Web pages (for example, EIA 2012, EIA 20131,2).

Description of evidence base

The key message and supporting text summarizes extensive evidence documented in the energy supply and use technical input.5 Global climate models simulate increases in summer temperatures, and the NCA climate scenarios14,25,26,27,28,29,30 describe this aspect of climate change projections for use in preparing this report (Ch. 2: Our Changing Climate). Data used by Kunkel et al.14 and Census Bureau population data, synthesized by the EIA,31 were the basis for calculating population-weighted heating and cooling degree-days over the historic period as well as projections assuming SRES B1 and A2 scenarios.

The NCA climate scenarios14 project an increase in the number of cooling days and decrease in heating days, with peak electricity demand in some regions shifting from winter to summer32 and shifting to electricity needs for cooling instead of fossil fuels for heating.10,7,32

New information and remaining uncertainties

While there is little uncertainty that peak electricity demands will increase with warming by climate change, substantial regional variability is expected. Climate change projections do not provide sufficient spatial and temporal detail to fully analyze these consequences. Socioeconomic factors including population changes, economic conditions, and energy prices, as well as technological developments in electricity generation and industrial equipment, will have a strong bearing on electricity demands, specific to each region of the country.

Assessment of confidence based on evidence

High. Assuming specific climate change scenarios, the consequences for heating and cooling buildings are reasonably predictable, especially for the residential sector. With a shift to higher summer demands for electricity, peak demands for electricity can be confidently expected to increase.

Confidence Level

Very High

Strong evidence (established theory, multiple sources, consistent results, well documented and accepted methods, etc.), high consensus

High

Moderate evidence (several sources, some consistency, methods vary and/or documentation limited, etc.), medium consensus

Medium

Suggestive evidence (a few sources, limited consistency, models incomplete, methods emerging, etc.), competing schools of thought

Low

Inconclusive evidence (limited sources, extrapolations, inconsistent findings, poor documentation and/or methods not tested, etc.), disagreement or lack of opinions among experts

Climate Change and Seasonal Energy Demands

Over the last 20 years, annual average temperatures typically have been higher than the long-term average; nationally, temperatures were above average during 12 of the last 14 summers (Ch. 2: Our Changing Climate).14 These increased temperatures are already affecting the demand for energy needed to cool buildings in the United States.

Figure 4.2: Increase in Cooling Demand and Decrease in Heating Demand

Increase in Cooling Demand and Decrease in Heating Demand

HeatingCooling

Figure 4.2: The amount of energy needed to cool (or warm) buildings is proportional to cooling (or heating) degree days. The figure shows increases in population-weighted cooling degree days, which result in increased air conditioning use, and decreases in population-weighted heating degree days, meaning less energy required to heat buildings in winter, compared to the average for 1970-2000. Cooling degree days are defined as the number of degrees that a day’s average temperature is above 65°F, while heating degree days are the number of degrees a day’s average temperature is below 65°F. As shown, the increase in cooling needs is greater than the decrease in heating needs (Data from NOAA NCDC 201233).

Details/Download

Average temperatures have increased in recent decades. In response, the Energy Information Administration began using 10-year average weather data instead of 30-year average weather data in order to estimate energy demands for heating and cooling purposes. The shorter period is more consistent with the observed trend of warmer winters and summers,11but is still not necessarily optimal for anticipating near-term temperatures.35

Figure 4.3: Increasing Numbers of Cooling Degree Days

Increasing Number of Cooling Degree Days

Lower Emissions (B1)HIgher Emissions (A2)

Figure 4.3: These maps show projected average changes in cooling degree days for two future time periods: 2021-2050 and 2070-2099 (as compared to the period 1971-2000). The higher emissions scenario (A2) assumes climate change associated with continued increases in emissions of heat-trapping gases, while the lower emissions scenario (B1) assumes significant reductions. The projections show significant regional variations, with the greatest increases in the southern United States by the end of this century under the higher emissions scenario. Furthermore, population projections suggest continued shifts toward areas that require air conditioning in the summer, thereby increasing the impact of temperature changes on increased energy demand.34 (Figure source: NOAA NCDC / CICS-NC).

Details/Download

While recognizing that many factors besides climate change affect energy demand (including population changes, economic conditions, energy prices, consumer behavior, conservation programs, and changes in energy-using equipment), increases in temperature will result in increased energy use for cooling and decreased energy use for heating. These impacts differ among regions of the country and indicate a shift from predominantly heating to predominantly cooling in some regions with moderate climates. For example, in the Northwest, energy demand for cooling is projected to increase over the next century due to population growth, increased cooling degree days, and increased use of air conditioners as people adapt to higher temperatures.36 Population growth is also expected to increase energy demand for heating. However, the projected increase in energy demand for heating is about half as much when the effects of a warming climate are considered along with population growth.36

Table 4.1: Changing Energy Use for Heating and Cooling Will Vary by Region

close
  Consequences: Challenges and Opportunities
Region Cooling Heating
Physical Impacts - High Likelihood Hotter and Longer Summers
Number of additional extreme hot days (> 95°F) and % increase in cooling degree days per year in 2041-2070 above 1971-2000 level
Warmer Winters
Number of fewer extreme cold days (< 10°F) and % decrease in heating degree days per year in 2041-2070 below 1971-2000 level
Northeast +10 days, +77% -12 days, -17%
Southeast +23 days, +43% -2 days, -19%
Midwest +14 days, +64% -14 days, -15%
Great Plains +22 days, +37% -4 days, -18%
Southwest +20 days, +44% -3 days, -20%
Northwest +5 days, +89% -7 days, -15%
Alaska Not studied Not studied
Pacific Islands Not studied Not studied

Table 4.1: Hotter and longer summers will increase the amount of electricity necessary to run air conditioning, especially in the Southeast and Southwest. Warmer winters will decrease the amount of natural gas required to heat buildings, especially in the Northeast, Midwest, and Northwest. Table information is adapted from multi-model means from eight NARCCAP regional climate simulations for the higher emissions scenario (A2) considered in this report and is weighted by population. (Source: adapted from Regional Climate Trends and Scenarios reports25,26,27,28,29,30)

Demands for electricity for cooling are expected to increase in every U.S. region as a result of increases in average temperatures and high temperature extremes. The electrical grid handles virtually the entire cooling load, while the heating load is distributed among electricity, natural gas, heating oil, passive solar, and biofuel. In order to meet increased demands for peak electricity, additional generation and distribution facilities will be needed, or demand will have to be managed through a variety of mechanisms. Electricity at peak demand typically is more expensive to supply than at average demand.9 Because the balance between heating and cooling differs by location, the balance of energy use among delivery forms and fuel types will likely shift from natural gas and fuel oil used for heating to electricity used for air conditioning. In hotter conditions, more fuel and energy are required to generate and deliver electricity, so increases in air conditioning use and shifts from heating to cooling in regions with moderate climates will increase primary energy demands.5

Climate-related temperature shifts are expected to cause a net increase in residential electricity use.9,37 Increased electricity demands for cooling will exceed electricity savings resulting from lower energy demands for heating. One study examining state-level energy consumption, weather data, and high emission scenarios (A2 and A1FI; Appendix 3: Climate Science Supplement) found a net increase of 11% in residential energy demand.38 Another study reported annual increases in net energy expenditures for cooling and heating of about 10% ($26 billion in 1990 U.S. dollars) by the end of this century for 4.5°F of warming, and 22% ($57 billion in 1990 dollars) for overall warming of about 9°F.39 New energy-efficient technology could help to offset growth in demand.

Several studies suggest that if substantial reductions in emissions of heat-trapping gases were required, the electricity generating sector would switch to using alternative (non-fossil) fuel sources first, given the multiple options available to generate electricity from sources that do not emit heat-trapping gases, such as wind and solar power. Under these circumstances, electricity would displace direct use of fossil fuels for some applications, such as heating, to reduce overall emissions of heat-trapping gases.10,7 The implications for peak electricity demand could be significant. In California, for example, the estimated increase in use of electricity for space heating would shift the peak in electricity demand from summer to winter.32 In addition, the fact that electricity from wind and solar is highly variable and may not be available when needed has the potential to decrease the reliability of the electricity system. However, some initial studies suggest that a well-designed electricity system with high penetration of renewable sources of energy should not decrease reliability (for example, Hand et al. 201240).

Key Message 3: Implications of Less Water for Energy Production

Changes in water availability, both episodic and long-lasting, will constrain different forms of energy production.

Supporting Evidence
close

Supporting Evidence

Process for Developing Key Messages:

The author team met bi-weekly by teleconference during the months of March through July 2012. Early in the development of key messages and a chapter outline, the authors reviewed all of the four dozen relevant technical input reports that were received in response to the Federal Register solicitation for public input. Selected authors participated in a U.S. Department of Energy (DOE) sponsored workshop on Energy Supply and Use, December 29-30, 2011 in Washington, D.C. The workshop was organized specifically to inform a DOE technical input report and this National Climate Assessment and to engage stakeholders in this process. The authors selected key messages based on the risk and likelihood of impacts, associated consequences, and available evidence. Relevance to decision support within the energy sector was also an important criterion.

The U.S. maintains extensive data on energy supply and use. The Energy Information Administration (EIA) of the U.S. Department of Energy is a primary organization in this activity, and data with quality control, quality assurance, and expert review are available through EIA Web pages (for example, EIA 2012, EIA 20131,2).

Description of evidence base

Climate scenarios prepared for the NCA14 describe decreases in precipitation under the SRES A2 scenario, with the largest decreases across the Northwest and Southwest in the spring and summer.

Technical input reports (for example, Wilbanks et al.5,9)summarize data and studies show that changes in water availability will affect energy production,41 and more specifically, that water shortages will constrain electricity production (Ch. 2: Our Changing Climate).42,43,44 The impacts of drought in Texas during 2011 are an example of the consequences of water shortages for energy production as well as other uses (Ch. 10: Energy, Water, and Land). Electric utility industry reports document potential consequences for operation of generating facilities.45 A number of power plants across the country have experienced interruptions due to water shortages.

New information and remaining uncertainties

An increasing number of documented incidents of interruptions in energy production due to water shortages provide strong evidence that decreased precipitation or drought will have consequences for energy production.9

There is little uncertainty that water shortages due to climate change will affect energy production. But uncertainty about changes in precipitation and moisture regimes simulated by global climate models is significantly higher than for simulated warming. Additionally, climate change simulations lack the spatial and temporal detail required to analyze the consequences for water availability at finer scales (for example, local and regional). Finer-scale projections would be relevant to decisions about changes in energy facilities to reduce risk or adapt to water shortages associated with climate change.

Assessment of confidence based on evidence

High. The evidence is compelling that insufficient water availability with climate change will affect energy production; however, simulations of climate change lack the detail needed to provide more specific information for decision support.

Confidence Level

Very High

Strong evidence (established theory, multiple sources, consistent results, well documented and accepted methods, etc.), high consensus

High

Moderate evidence (several sources, some consistency, methods vary and/or documentation limited, etc.), medium consensus

Medium

Suggestive evidence (a few sources, limited consistency, models incomplete, methods emerging, etc.), competing schools of thought

Low

Inconclusive evidence (limited sources, extrapolations, inconsistent findings, poor documentation and/or methods not tested, etc.), disagreement or lack of opinions among experts

Implications of Less Water for Energy Production

Producing energy from fossil fuels (coal, oil, and natural gas), nuclear power, biofuels, hydropower, and some solar power systems often requires adequate and sustainable supplies of water. Issues related to water, including availability and restrictions on the temperature of cooling water returned to streams, already pose challenges to production from existing power plants and the ability to obtain permits to build new facilities (Ch. 10: Energy, Water, and Land).9,42,46,43

In the future, long-term precipitation changes, drought, and reduced snowpack are projected to alter water availability (Ch. 3: Water). Recent climate data indicate a national average increase in annual precipitation, owing to significant increases across the central and northeastern portions of the nation and a mix of increases and decreases elsewhere (Ch. 2: Our Changing Climate, Figure 2.12). Projected changes in precipitation are small in most areas of the United States, but vary both seasonally and regionally (Figure 4.4). The number of heavy downpours has generally increased and is projected to increase for all regions (Ch 2: Our Changing Climate, Figures 2.16, 2.17, 2.18, and 2.19). Different analyses of observed changes in dry spell length do not show clear trends,47,48,49 but longer dry spells are projected in southern regions and the Northwest (Ch. 2: Our Changing Climate, Figure 2.13) as a result of projected large-scale changes in circulation patterns.

Figure 4.4: Projected Changes in Seasonal Precipitation Projected Changes in Seasonal Precipitation Details/Download

Regional or seasonal water constraints, particularly in the Southwest and Southeast, will result from chronic or seasonal drought, growing populations, and increasing demand for water for various uses (Ch. 2: Our Changing Climate; Ch. 10: Energy, Water, and Land).42,43,44 Reduced availability of water for cooling, for hydropower, or for absorbing warm water discharges into water bodies without exceeding temperature limits, will continue to constrain power production at existing facilities and permitting of new power plants. Increases in water temperatures may reduce the efficiency of thermal power plant cooling technologies, potentially leading to warmer water discharge from some power plants, which in turn can affect aquatic life. Studies conducted during 2012 indicate that there is an increasing likelihood of water shortages limiting power plant electricity production in many regions.9,41

Hydropower plants in the western United States depend on the seasonal cycle of snowmelt to provide steady output throughout the year. Expected reductions in snowpack in parts of the western U.S. will reduce hydropower production. There will also be increases in energy (primarily electricity) demand in order to pump water for irrigated agriculture and to pump and treat water for municipal uses.9

The Electric Power Research Institute’s (EPRI) scenario-based technical projections of water demand in 2030 find that one-quarter of existing power generation facilities (about 240,000 megawatts) nationwide are in counties that face some type of water sustainability issue.45 Many regions face water sustainability concerns, with the most significant water-related stresses in the Southeast, Southwest, and Great Plains regions (Ch. 3: Water).45

Key Message 4: Sea Level Rise and Infrastructure Damage

In the longer term, sea level rise, extreme storm surge events, and high tides will affect coastal facilities and infrastructure on which many energy systems, markets, and consumers depend.

Supporting Evidence
close

Supporting Evidence

Process for Developing Key Messages:

The author team met bi-weekly by teleconference during the months of March through July 2012. Early in the development of key messages and a chapter outline, the authors reviewed all of the four dozen relevant technical input reports that were received in response to the Federal Register solicitation for public input. Selected authors participated in a U.S. Department of Energy (DOE) sponsored workshop on Energy Supply and Use, December 29-30, 2011 in Washington, D.C. The workshop was organized specifically to inform a DOE technical input report and this National Climate Assessment and to engage stakeholders in this process. The authors selected key messages based on the risk and likelihood of impacts, associated consequences, and available evidence. Relevance to decision support within the energy sector was also an important criterion.

The U.S. maintains extensive data on energy supply and use. The Energy Information Administration (EIA) of the U.S. Department of Energy is a primary organization in this activity, and data with quality control, quality assurance, and expert review are available through EIA Web pages (for example, EIA 2012, EIA 20131,2).

Description of evidence base

The sea level change scenario report prepared for the NCA (see also Ch. 2: Our Changing Climate)50 provides further information about sea level change. Extreme surge events at high tides are expected to increase,18,19 raising the risk of inundating energy facilities such as power plants, refineries, pipelines, and transmission and distribution networks (for example, Sathaye et al. 20136) Data available through the EIA (for example, EIA 201031 provide high-quality information about the locations and distribution of energy facilities.

A substantial portion of the nation’s energy facilities and infrastructure are located along coasts or offshore, and sea level rise will affect these facilities (Ch. 25: Coasts; Ch. 17: Southeast; Ch. 5: Transportation).5,6,9,51

New information and remaining uncertainties

Projections of sea level change are relatively uncertain compared to other aspects of climate change. More importantly, there will be substantial regional and local variability in sea level change, and facilities in locations exposed to more frequent and intense extreme wind and precipitation events will be at higher risk. Data and analyses to understand regional and local sea level change are improving, but substantial uncertainty remains and decision support for adaptation is challenged by these limitations.

Assessment of confidence based on evidence

High. There is high confidence that increases in global mean sea level, extreme surge events, and high tides will affect coastal energy facilities; however, regional and local details are less certain.

Confidence Level

Very High

Strong evidence (established theory, multiple sources, consistent results, well documented and accepted methods, etc.), high consensus

High

Moderate evidence (several sources, some consistency, methods vary and/or documentation limited, etc.), medium consensus

Medium

Suggestive evidence (a few sources, limited consistency, models incomplete, methods emerging, etc.), competing schools of thought

Low

Inconclusive evidence (limited sources, extrapolations, inconsistent findings, poor documentation and/or methods not tested, etc.), disagreement or lack of opinions among experts

Sea Level Rise and Infrastructure Damage

In the longer term, sea level rise, extreme storm surge events, and high tides will affect coastal facilities and infrastructure on which many energy systems, markets, and consumers depend.

Significant portions of the nation’s energy production and delivery infrastructure are in low-lying coastal areas; these facilities include oil and natural gas production and delivery facilities, refineries, power plants, and transmission lines.

Figure 4.5: California Power Plants Potentially at Risk from Sea Level Rise California Power Plants Potentially at Risk from Sea Level Rise Details/Download

Global sea level has risen by about 8 inches since reliable record keeping began in 1880, affecting countries throughout the world, including the United States. The rate of rise increased in recent decades and is not expected to slow. Global average sea level is projected to rise 1 to 4 feet by 2100 and is expected to continue to rise well beyond this century (Ch. 2: Our Changing Climate). Sea level change at any particular location can deviate substantially from this global average (Ch. 2: Our Changing Climate).50

Rising sea levels, combined with normal and potentially more intense coastal storms, an increase in very heavy precipitation events, and local land subsidence, threaten coastal energy equipment as a result of inundation, flooding, and erosion. This can be compounded in areas that are projected to receive more precipitation. In particular, sea level rise and coastal storms pose a danger to the dense network of Outer Continental Shelf marine and coastal facilities in the central Gulf Coast region.51 Many of California’s power plants are at risk from rising sea levels, which result in more extensive coastal storm flooding, especially in the low-lying San Francisco Bay area (Figure 4.5). Power plants and energy infrastructure in coastal areas throughout the United States face similar risks.

Table 4.2 summarizes actions that can be taken to increase the ease with which energy systems can adjust to climate change. Many of these adaptation investments entail “no regrets” actions, providing short-term benefits because they address current vulnerabilities as well as future risks.

Table 4.2: Possible Climate Resilience and Adaptation Actions in Energy Sector

close

Key Challenges Addressed

Possible Actions Extreme Weather Events Increase in Peak Energy Loads Water Constraints on Energy Production Sea Level Rise
Supply: System and Operational Planning        
Diversifying supply chains X X X X
Strengthening and coordinating emergency response plans X X X  
Providing remote/protected emergency-response coordination centers X      
Developing flood-management plans or improving stormwater management X     X
Developing drought-management plans for reduced cooling flows     X  
Developing hydropower management plans/policies addressing extremes     X  
Supply: Existing Equipment Modifications        
Hardening/building redundancy into facilities X X    
Elevating water-sensitive equipment or redesigning elevation of intake structures X     X
Building coastal barriers, dikes, or levees X     X
Improving reliability of grid systems through back-up power supply, intelligent controls, and distributed generation X X X  
Insulating equipment for temperature extremes X      
References to technical studies with case studies on many of these topics may be found in Wilbanks et al. 2012.5        
Implementing dry (air-cooled) or low-water hybrid (or recirculating) cooling systems for power plants     X  
Adding technologies/systems to pre-cool water discharges     X  
Using non-fresh water supplies: municipal effluent, brackish or seawater     X  
Relocating vulnerable facilities X   X X
Supply: New Equipment        
Adding peak generation, power storage capacity, and distributed generation X X X X
Adding back-up power supply for grid interruptions X X X  
Increasing transmission capacity within and between regions X X X X
Use: Reduce Energy Demand        
Improving building energy, cooling-system and manufacturing efficiencies, and demand-response capabilities (for example, smart grid) X X    
Setting higher ambient temperatures in buildings X X    
Improving irrigation and water distribution/reuse efficiency   X X  
Allowing flexible work schedules to transfer energy use to off-peak hours   X    

Table 4.2: A range of climate change impacts will affect future energy production. This table shows possible ways to anticipate and respond to these changes. Innovations in technologies may provide additional opportunities and benefits to these and other adaptation actions. Behavioral change by consumers can also promote resiliency.

Key Message 5: Future Energy Systems

As new investments in energy technologies occur, future energy systems will differ from today’s in uncertain ways. Depending on the character of changes in the energy mix, climate change will introduce new risks as well as opportunities.

Supporting Evidence
close

Supporting Evidence

Process for Developing Key Messages:

The author team met bi-weekly by teleconference during the months of March through July 2012. Early in the development of key messages and a chapter outline, the authors reviewed all of the four dozen relevant technical input reports that were received in response to the Federal Register solicitation for public input. Selected authors participated in a U.S. Department of Energy (DOE) sponsored workshop on Energy Supply and Use, December 29-30, 2011 in Washington, D.C. The workshop was organized specifically to inform a DOE technical input report and this National Climate Assessment and to engage stakeholders in this process. The authors selected key messages based on the risk and likelihood of impacts, associated consequences, and available evidence. Relevance to decision support within the energy sector was also an important criterion.

The U.S. maintains extensive data on energy supply and use. The Energy Information Administration (EIA) of the U.S. Department of Energy is a primary organization in this activity, and data with quality control, quality assurance, and expert review are available through EIA Web pages (for example, EIA 2012, EIA 20131,2).

Description of evidence base

A number of studies describe U.S. energy system configurations in terms of supply and use assuming different scenarios of climate change, including SRES B1 and A2.11,10,45 A technical input report to the NCA by DOE5,9 provides details and updates earlier studies. The potential role of biofuels is described within Chapters 6 and 7 of this report (Ch. 6: Agriculture; Ch. 7: Forests).

New information and remaining uncertainties

Understanding of options for future energy supply and use within the U.S. improves, as the EIA and other organizations update data and information about U.S. energy systems as well as projections of the mix of primary energy under various assumptions about demographic, economic, and other factors. With additional data and better models, alternative energy mixes can be explored with respect to climate change adaptation and mitigation. But numerous factors that are very difficult to predict – financial, economic, regulatory, technological – affect the deployment of actual facilities and infrastructure.

Assessment of confidence based on evidence

High. Given the evidence about climate change impacts and remaining uncertainties associated with the future configuration of energy systems and infrastructure, there is high confidence that U.S. energy systems will evolve in ways that affect risk with respect to climate change and options for adaptation or mitigation.

Confidence Level

Very High

Strong evidence (established theory, multiple sources, consistent results, well documented and accepted methods, etc.), high consensus

High

Moderate evidence (several sources, some consistency, methods vary and/or documentation limited, etc.), medium consensus

Medium

Suggestive evidence (a few sources, limited consistency, models incomplete, methods emerging, etc.), competing schools of thought

Low

Inconclusive evidence (limited sources, extrapolations, inconsistent findings, poor documentation and/or methods not tested, etc.), disagreement or lack of opinions among experts

Future Energy Systems

Countless aspects of the U.S. economy today are supported by reliable, affordable, and accessible energy supplies. Electricity and other forms of energy are necessary for telecommunications, water and sewer systems, banking, public safety, and more. Today’s energy systems vary significantly by region, however, with differences in climate-related impacts also introducing considerable variation by locale. Table 4.3 shows projected impacts of climate change on, and potential risks to, energy systems as they currently exist in different regions. Most vulnerabilities and risks for energy supply and use are unique to local situations, but others are national in scope. For example, biofuels production in three regions (Midwest, Great Plains, and Southwest) could be affected by the projected decrease in precipitation during the critical growing season in the summer months (Ch. 10: Energy, Water, and Land; Ch. 7: Forests).

One certainty about future energy systems is that they will be different than today’s, but in ways not yet known. Many uncertainties – financial, economic, regulatory, technological, and so on – will affect private and public consumption and investment decisions on energy fuels, infrastructure, and systems. Energy systems will evolve over time, depending upon myriad choices made by countless decision-makers responding to changing conditions in markets, technologies, policies, consumer preferences, and climate. A key challenge to understanding the nature and intensity of climate change impacts on future energy systems is the amount of uncertainty regarding future choices about energy technologies and their deployment. An evolving energy system is also an opportunity to develop an energy system that is more resilient and less vulnerable to climate change.

Table 4.3: Energy Supply: Summary of National and Regional Impacts, Challenges and Opportunities

close
  Consequencesa: Challenges and Opportunities
  Fuel Extraction, Production, and Refining Fuel
Distribution
Transport/
Pipelines
Electricity Generation Electricity Distribution
  Hydrocarbonsb Biofuels Thermal Power Generationc  
Physical Impacts – High Likelihood Increased ambient temperature of air and water Increased extremes in water availability Coastal erosion and sea level rise Increased ambient temperature of air and water Increased extremes in water availability Coastal erosion and sea level rise Hot summer periods
National Trend Summaryf -Consequence Decreased production and refining capacity Decreased agricultural yields Damage to facilities Reduced plant efficiency and cooling capacity Interruptions to cooling systems Damage to facilities Reduced capacity/ damage to lines
Key Indicator
(2071-2099 vs. 1971-2000)
Mean Annual Temperatured Summer Precipitationd Sea Level Risee
(2100)
Mean Annual Temperatured Summer Precipitationd Sea Level Risee
(2100)
# Days > 90Ff,g
(2055)
Northeast + 4°F to 9°F –5% to +6% 1.6 – 3.9 ft
(0.5 – 1.2 m)
+ 4°F to 9°F –5% to +6% 1.6 – 3.9 ft
(0.5 – 1.2 m)
+13 days
Southeast + 3°F to 8°F –22% to +10% + 3°F to 8°F –22% to +10% +31 days
Midwest + 4°F to 10°F –22% to +7% + 4°F to 10°F –22% to +7% +19 days
Great Plains + 3°F to 9°F –27% to +5% +3°F to 9°F –27% to +5% +20 days
Southwest + 4°F to 9°F –13% to +3% + 4°F to 9°F –13% to +3% +24 days
Northwest + 3°F to 8°F –34% to –4% + 3°F to 8°F –34% to –4% +4 days
Alaska + 4°F to 9°F +10% to +25% + 4°F to 9°F +10% to +25% No projection.
Pacific Islands + 2°F to 5°F Range from little change to increases + 2°F to 5°F Range from little change to increases No projection

Notes

  1. Excludes extreme weather events.
  2. Hydrocarbons include coal, oil, and gas including shales.
  3. Thermal power generation includes power plants fired from nuclear, coal, gas, oil, biomass fuels, solar thermal, and geothermal energy.
  4. CMIP3 15 GCM Models: 2070–2099 Combined Interquartile Ranges of SRES B1 and A2 (versus 1971–2000), incorporating uncertainties from both differences in model climate sensitivity and differences between B1 and A2 in emissions trajectories
  5. Range of sea level rise for 2100 is the Low Intermediate to High Intermediate Scenario from “Sea Level Change Scenarios for the U.S. National Climate Assessment.”50 Range is similar to the 1 to 4 feet of sea level rise projected in Ch. 2: Our Changing Climate, Key Message 10. There will be regional variations in sea level rise, and this category of impacts does not apply for the Midwest region.
  6. 2055 NARCCAP
  7. References: 5,10

Table 4.3: Increased temperatures, changing precipitation patterns, and sea level rise will affect many sectors and regions, including energy production, agriculture yields, and infrastructure damage. Changes are also projected to affect hydropower, solar photovoltaic, and wind power, but the projected impacts are not well defined at this time.

Very different future energy supply portfolios are possible depending upon key economic assumptions, including what climate legislation may look like,11,10,45 and whether significant changes in consumption patterns occur for a variety of other reasons. Renewable energy sources, including solar, wind, hydropower, biofuels, and geothermal are meeting a growing portion of U.S. demand, and there is the opportunity for this contribution to increase in the future (Ch. 6: Agriculture; Ch. 7: Forests). This fundamental uncertainty about the evolving character of energy systems contributes another layer of complexity to understanding how climate change will affect energy systems.

As they consider actions to enhance the resiliency of energy systems, decision-makers confront issues with current energy systems as well as possible future configurations. The systems will evolve and will be more resilient over time if actions tied to features of today’s systems do not make future systems less resilient as a result. For example, if moving toward biomass as an energy source involves more water-consumptive energy supplies that could be constrained by drier future climate conditions, then decisions about energy choices should be made with consideration of potential changes in climate conditions and the risks these changes present (See Ch. 26: Decision Support).

Because energy systems in the United States are not centrally planned, they tend to reflect energy decisions shaped by law, regulation, other policies, and economic, technological, and other factors in markets. Trends in use patterns may continue into the future; this is an opportunity to increase resilience but also a major uncertainty for energy utilities and policy makers. Energy infrastructure tends to be long-lived, so resiliency can be enhanced by more deliberate applications of risk-management techniques and information about anticipated climate impacts and trends.53

For example, risk-management approaches informed by evolving climate conditions could be used to project the value of research and development on, or investments in, construction of dikes and barriers for coastal facilities or for dry-cooling technologies for power plants in regions where water is already in short supply. Solar and wind electricity generation facilities could be sited in areas that are initially more expensive (such as offshore areas) but less subject to large reductions in power plant output resulting from climatic changes. Targets for installed reserve margins for electric generating capacity and capacity of power lines can be established using certain temperature expectations, but adjusted as conditions unfold over time.

References

  1. Andreadis, K. M., and D. P. Lettenmaier, 2006: Trends in 20th century drought over the continental United States. Geophysical Research Letters, 33, L10403, doi:10.1029/2006GL025711. | Detail

  2. Averyt, K., J. Macknick, J. Rogers, N. Madden, J. Fisher, J. Meldrum, and R. Newmark, 2013: Water use for electricity in the United States: An analysis of reported and calculated water use information for 2008. Environmental Research Letters, 8, 015001, doi:10.1088/1748-9326/8/1/015001. URL | Detail

  3. ,, 2010: Building a Resilient Energy Gulf Coast: Executive Report. 11 pp., America’s Wetland Foundation, America’s Energy Coast, and Entergy. URL | Detail

  4. ,, 2012: Tropical Storm Isaac Activity Statistics Final Update: September 11, 2012. Bureau of Safety and Environmental Enforcement. URL | Detail

  5. Burkett, V., 2011: Global climate change implications for coastal and offshore oil and gas development. Energy Policy, 39, 7719-7725, doi:10.1016/j.enpol.2011.09.016. | Detail

  6. Cayan, D. R., P. D. Bromirski, K. Hayhoe, M. Tyree, M. D. Dettinger, and R. E. Flick, 2008: Climate change projections of sea level extremes along the California coast. Climatic Change, 87, 57-73, doi:10.1007/s10584-007-9376-7. | Detail

  7. ,, 2007: Executive Summary. Effects of Climate Change on Energy Production and Use in the United States. A Report by the U.S. Climate Change Science Program and the subcommittee on Global Change Research, T.J. Wilbanks, Bhatt, V., Bilello, D.E., Bull, S.R., Ekmann, J., Horak, W.C., Huang, Y.J., Levine, M.D., Sale, M.J., Schmalzer, D.K., and Scott, M.J., Eds., Department of Energy, Office of Biological & Environmental Research, x-xii. URL | Detail

  8. Clarke, L., J. Edmonds, H. Jacoby, H. Pitcher, J. Reilly, and R. Richels, 2007: Scenarios of Greenhouse Gas Emissions and Atmospheric Concentrations–US Climate Change Science Program Synthesis and Assessment Product 2.1a. Sub-report 2.1A of Synthesis and Assessment Product 2.1. 154 pp., U.S. Department of Energy, Office of Biological & Environmental Research, Washington, D.C. URL | Detail

  9. Deschênes, O., and M. Greenstone, 2011: Climate change, mortality, and adaptation: Evidence from annual fluctuations in weather in the US. American Economic Journal: Applied Economics, 3, 152-185, doi:10.1257/app.3.4.152. | Detail

  10. ,, 2010: Hardening and Resiliency. U.S. Energy Industry Response to Recent Hurricane Seasons. 74 pp., U.S. Department of Energy. URL | Detail

  11. ,, 2008: Annual Energy Outlook. DOE/EIA-0383(2008). Department of Energy, Energy Information Administration. URL | Detail

  12. ,, 2010: Annual Energy Outlook 2010 with Projections to 2035. U.S. Energy Information Administration. URL | Detail

  13. ,, 2012: Annual Energy Outlook 2012 with Projections to 2035. DOE/EIA-0383(2012). 239 pp., U.S. Energy Information Administration, Washington, D.C. URL | Detail

  14. ,, 2013: Gulf of Mexico Fact Sheet. U.S. Department of Energy, U.S. Energy Information Administration. URL | Detail

  15. ,, 2013: Hurricane Impacts on the U.S. Oil and Natural Gas Markets. U.S. Department of Energy, U.S. Energy Information Administration. URL | Detail

  16. ,, 2013: Monthly Energy Review. U.S. Department of Energy, U.S. Energy Information Administration, Washington, D.C. URL | Detail

  17. ,, 2013: Federal Offshore--Gulf of Mexico Natural Gas Gross Withdrawals. U.S. Department of Energy, U.S. Energy Information Administration. URL | Detail

  18. ,, 2013: Water Quality Standards for Surface Waters. U.S. Environmental Protection Agency. URL | Detail

  19. ,, 2011: Water Use for Electricity Generation and Other Sectors: Recent Changes (1985-2005) and Future Projections (2005-2030). 2011 Technical Report. 94 pp., Electric Power Research Institute, Palo Alto, CA. URL | Detail

  20. Franco, G., D. R. Cayan, S. Moser, M. Hanemann, and M. - A. Jones, 2011: Second California Assessment: Integrated climate change impacts assessment of natural and managed systems. Guest editorial. Climatic Change, 109, 1-19, doi:10.1007/s10584-011-0318-z. | Detail

  21. Groisman, P. Ya, and R. W. Knight, 2008: Prolonged dry episodes over the conterminous United States: New tendencies emerging during the last 40 years. Journal of Climate, 21, 1850-1862, doi:10.1175/2007JCLI2013.1. URL | Detail

  22. Hamlet, A. F., S. Y. Lee, K. E. B. Mickelson, and M. M. Elsner, 2010: Effects of projected climate change on energy supply and demand in the Pacific Northwest and Washington State. Climatic Change, 102, 103-128, doi:10.1007/s10584-010-9857-y. | Detail

  23. Hand, M. M., S. Baldwin, E. DeMeo, J. M. Reilly, T. Mai, D. Arent, G. Porro, M. Meshek, and D. Sandor, 2012: Renewable Electricity Futures Study (Entire Report). NREL/TP-6A20-52409. National Renewable Energy Laboratory (NREL). URL | Detail

  24. Hibbard, P. J., 2006: US Energy Infrastructure Vulnerability: Lessons From the Gulf Coast Hurricanes, prepared for National Commission on Energy Policy. 39 pp., Analysis Group. URL | Detail

  25. ,, 2007: Climate Change 2007: The Physical Science Basis. Contribution of Working Group I to the Fourth Assessment Report of the Intergovernmental Panel on Climate Change. Cambridge University Press, 996 pp. URL | Detail

  26. ,, 2012: Managing the Risks of Extreme Events and Disasters to Advance Climate Change Adaptation. A Special Report of Working Groups I and II of the Intergovernmental Panel on Climate Change. Cambridge University Press, 582 pp. URL | Detail

  27. Kunkel, K. E., L. E. Stevens, S. E. Stevens, L. Sun, E. Janssen, D. Wuebbles, K. T. Redmond, and J. G. Dobson, 2013: Regional Climate Trends and Scenarios for the U.S. National Climate Assessment: Part 5. Climate of the Southwest U.S. NOAA Technical Report NESDIS 142-5. 87 pp., National Oceanic and Atmospheric Administration, National Environmental Satellite, Data, and Information Service, Washington, D.C. URL | Detail

  28. Kunkel, K. E., L. E. Stevens, S. E. Stevens, L. Sun, E. Janssen, D. Wuebbles, S. D. Hilberg, M. S. Timlin, L. Stoecker, N. E. Westcott, and J. G. Dobson, 2013: Regional Climate Trends and Scenarios for the U.S. National Climate Assessment: Part 3. Climate of the Midwest U.S. NOAA Technical Report NESDIS 142-3. 103 pp., National Oceanic and Atmospheric Administration, National Environmental Satellite, Data, and Information Service, Washington, D.C. URL | Detail

  29. Kunkel, K. E., L. E. Stevens, S. E. Stevens, L. Sun, E. Janssen, D. Wuebbles, C. E. Konrad, II, C. M. Fuhrman, B. D. Keim, M. C. Kruk, A. Billet, H. Needham, M. Schafer, and J. G. Dobson, 2013: Regional Climate Trends and Scenarios for the U.S. National Climate Assessment: Part 2. Climate of the Southeast U.S. NOAA Technical Report 142-2. 103 pp., National Oceanic and Atmospheric Administration, National Environmental Satellite, Data, and Information Service, Washington D.C. URL | Detail

  30. Kunkel, K. E., L. E. Stevens, S. E. Stevens, L. Sun, E. Janssen, D. Wuebbles, and J. G. Dobson, 2013: Regional Climate Trends and Scenarios for the U.S. National Climate Assessment: Part 9. Climate of the Contiguous United States. NOAA Technical Report NESDIS 142-9. 85 pp., National Oceanic and Atmospheric Administration, National Environmental Satellite, Data, and Information Service, Washington, D.C. URL | Detail

  31. Kunkel, K. E., L. E. Stevens, S. E. Stevens, L. Sun, E. Janssen, D. Wuebbles, K. T. Redmond, and J. G. Dobson, 2013: Regional Climate Trends and Scenarios for the U.S. National Climate Assessment: Part 6. Climate of the Northwest U.S. NOAA Technical Report NESDIS 142-6. 83 pp., National Oceanic and Atmospheric Administration, National Environmental Satellite, Data, and Information Service, Washington, D.C. URL | Detail

  32. Kunkel, K. E., L. E. Stevens, S. E. Stevens, L. Sun, E. Janssen, D. Wuebbles, J. Rennells, A. DeGaetano, and J. G. Dobson, 2013: Regional Climate Trends and Scenarios for the U.S. National Climate Assessment: Part 1. Climate of the Northeast U.S. NOAA Technical Report NESDIS 142-1. 87 pp., National Oceanic and Atmospheric Administration, National Environmental Satellite, Data, and Information Service, Washington, D.C. URL | Detail

  33. Kunkel, K. E., L. E. Stevens, S. E. Stevens, L. Sun, E. Janssen, D. Wuebbles, M. C. Kruk, D. P. Thomas, M. D. Shulski, N. Umphlett, K. G. Hubbard, K. Robbins, L. Romolo, A. Akyuz, T. Pathak, T. R. Bergantino, and J. G. Dobson, 2013: Regional Climate Trends and Scenarios for the U.S. National Climate Assessment: Part 4. Climate of the U.S. Great Plains. NOAA Technical Report NESDIS 142-4. 91 pp., National Oceanic and Atmospheric Administration, National Environmental Satellite, Data, and Information Service, Washington, D.C. URL | Detail

  34. Macknick, J., S. Sattler, K. Averyt, S. Clemmer, and J. Rogers, 2012: The water implications of generating electricity: Water use across the United States based on different electricity pathways through 2050. Environmental Research Letters, 7, 045803, doi:10.1088/1748-9326/7/4/045803. URL | Detail

  35. Mansur, E., R. Mendelsohn, and W. Morrison, 2008: Climate change adaptation: A study of fuel choice and consumption in the US energy sector. Journal of Environmental Economics and Management, 55, 175-93, doi:10.1016/j.jeem.2007.10.001. | Detail

  36. McCabe, G. J., D. R. Legates, and H. F. Lins, 2010: Variability and trends in dry day frequency and dry event length in the southwestern United States. Journal of Geophysical Research: Atmospheres, 115, D07108, doi:10.1029/2009JD012866. | Detail

  37. ,, 2012: Heating & Cooling Degree Day Data. NOAA’s National Climatic Data Center. URL | Detail

  38. ,, 2013: Billion Dollar Weather/Climate Disasters. National Oceanic and Atmospheric Administration. URL | Detail

  39. ,, 2011: Climate Stabilization Targets: Emissions, Concentrations, and Impacts over Decades to Millennia. National Research Council. The National Academies Press, 298 pp. URL | Detail

  40. Parris, A., P. Bromirski, V. Burkett, D. Cayan, M. Culver, J. Hall, R. Horton, K. Knuuti, R. Moss, J. Obeysekera, A. Sallenger, and J. Weiss, 2012: Global Sea Level Rise Scenarios for the United States National Climate Assessment. NOAA Tech Memo OAR CPO-1. 37 pp., National Oceanic and Atmospheric Administration, Silver Spring, MD. URL | Detail

  41. Pendleton, L., T. R. Karl, and E. Mills, 2013: Economic growth in the face of weather and climate extremes: A call for better data. Eos, Transactions, American Geophysical Union, 94, 225-226, doi:10.1002/2013eo250005. URL | Detail

  42. Peterson, T. C., P. A. Stott, and S. Herring, 2012: Explaining extreme events of 2011 from a climate perspective. Bulletin of the American Meteorological Society, 93, 1041-1067, doi:10.1175/BAMS-D-12-00021.1. URL | Detail

  43. Sathaye, J., L. Dale, P. Larsen, G. Fitts, K. Koy, S. Lewis, and A. Lucena, 2011: Estimating Risk to California Energy Infrastructure from Projected Climate Change. 85 pp., Ernest Orlando Lawrence Berkeley National Laboratory, California Energy Commission, Berkeley, CA. URL | Detail

  44. Sathaye, J. A., L. L. Dale, P. H. Larsen, G. A. Fitts, K. Koy, S. M. Lewis, and A. Frossard P. de Lucena, 2013: Estimating impacts of warming temperatures on California's electricity system. Global Environmental Change, 23, 499-511, doi:10.1016/j.gloenvcha.2012.12.005. | Detail

  45. Skaggs, R., K. Hibbard, P. Frumhoff, T. Lowry, R. Middleton, R. Pate, V. Tidwell, J. Arnold, K. Avert, A. Janetos, C. Izaurralde, J. Rice, and S. Rose, 2012: Climate and Energy-Water-Land System Interactions. Technical Report to the U.S. Department of Energy in Support of the National Climate Assessment. PNNL-21185. 152 pp., Pacific Northwest National Laboratory, Richland, Washington. URL | Detail

  46. Strzepek, K., G. Yohe, J. Neumann, and B. Boehlert, 2010: Characterizing changes in drought risk for the United States from climate change. Environmental Research Letters, 5, 044012, doi:10.1088/1748-9326/5/4/044012. URL | Detail

  47. ,, 2012: U.S. Population Projections. U.S. Census Bureau, U.S. Department of Commerce. URL | Detail

  48. Vose, R. S. et al., 2013: Monitoring and understanding changes in extremes: Extratropical storms, winds, and waves. Bulletin of the American Meteorological Society, in press, doi:10.1175/BAMS-D-12-00162.1. URL | Detail

  49. Wei, M., N. H. James, G. B. Jeffery, M. Ana, J. Josiah, T. Michael, Y. Christopher, J. Chris, M. M. E. James, and K. M. Daniel, 2013: Deep carbon reductions in California require electrification and integration across economic sectors. Environmental Research Letters, 8, 014038, doi:10.1088/1748-9326/8/1/014038. URL | Detail

  50. Wilbanks, T., D. Bilello, D. Schmalzer, and M. Scott, 2012: Climate Change and Energy Supply and Use. Technical Report to the U.S. Department of Energy in Support of the National Climate Assessment. 79 pp., Oak Ridge National Laboratory, U.S. Department of Energy, Office of Science, Oak Ridge, TN. URL | Detail

  51. Wilbanks, T., S. Fernandez, G. Backus, P. Garcia, K. Jonietz, P. Kirshen, M. Savonis, B. Solecki, and L. Toole, 2012: Climate Change and Infrastructure, Urban Systems, and Vulnerabilities. Technical Report to the U.S. Department of Energy in Support of the National Climate Assessment. 119 pp., Oak Ridge National Laboratory. U.S. Department of Energy, Office of Science, Oak Ridge, TN. URL | Detail

  52. Wilks, D. S., and R. E. Livezey, 2013: Performance of alternative “normals” for tracking climate changes, using homogenized and nonhomogenized seasonal U.S. surface temperatures. Journal of Applied Meteorology and Climatology, 52, 1677-1687, doi:10.1175/JAMC-D-13-026.1. URL | Detail

  53. Williams, J. H., A. DeBenedictis, R. Ghanadan, A. Mahone, J. Moore, W. R. Morrow III, S. Price, and M. S. Torn, 2012: The technology path to deep greenhouse gas emissions cuts by 2050: The pivotal role of electricity. Science, 335, 53-59, doi:10.1126/science.1208365. | Detail

The National Climate Assessment summarizes the impacts of climate change on the United States, now and in the future.

A team of more than 300 experts guided by a 60-member Federal Advisory Committee produced the report, which was extensively reviewed by the public and experts, including federal agencies and a panel of the National Academy of Sciences.

United States Global Change Research Program logo United States Global Change Research Program participating agency logos