Introduction
The cycle of life is intricately joined with the cycle of water.
– Jacques-Yves Cousteau
This chapter contains three main sections: climate change impacts on the water cycle, climate change impacts on water resources use and management, and adaptation and institutional responses.
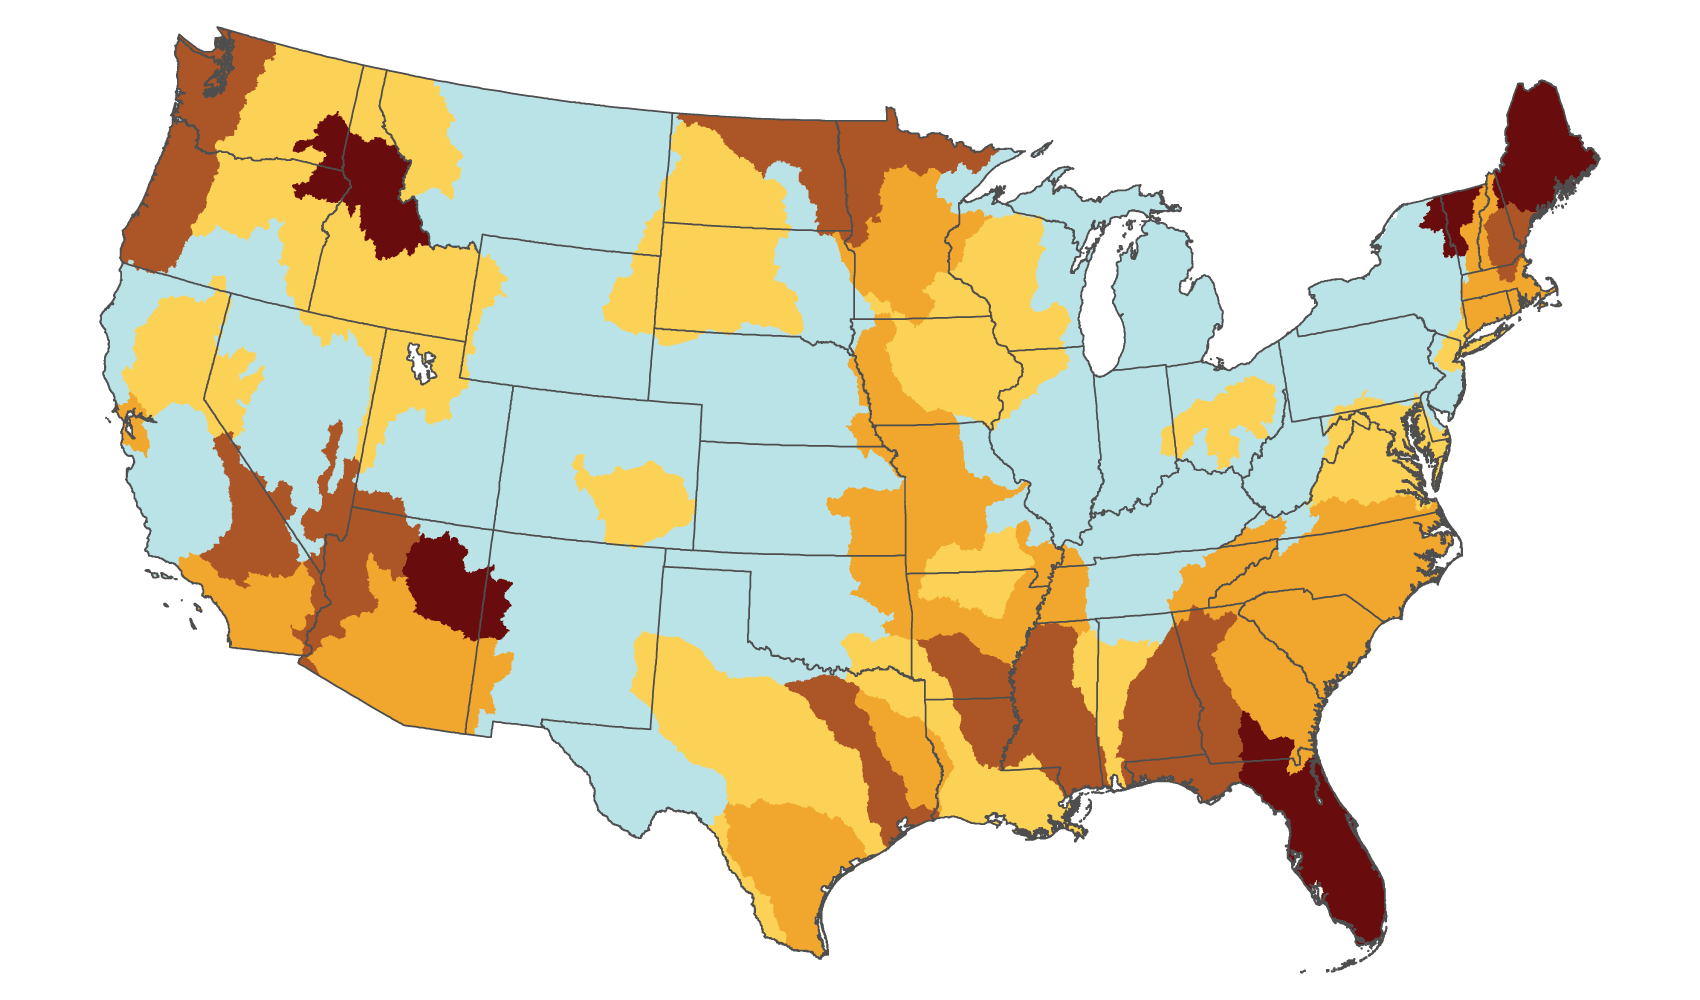
Climate Change Impacts on the Water Cycle
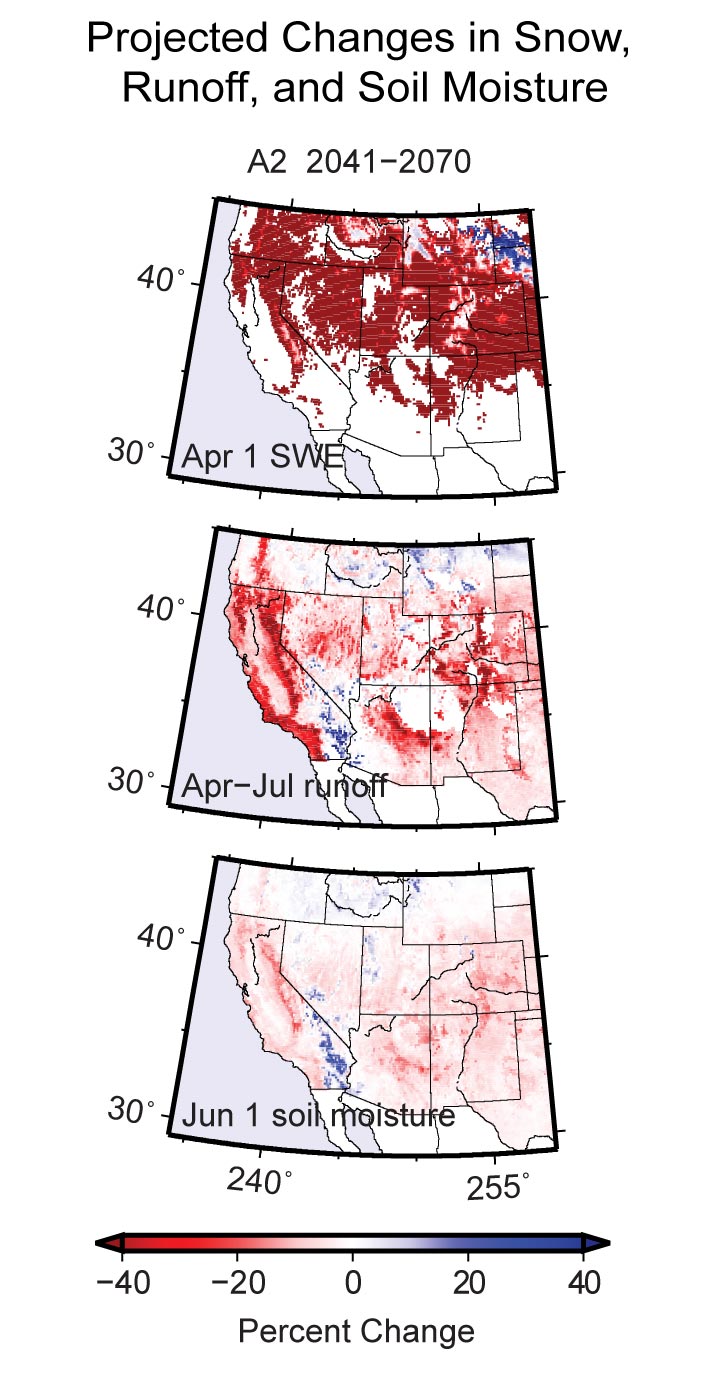
Water cycles constantly from the atmosphere to the land and the oceans (through precipitation and runoff) and back to the atmosphere (through evaporation and the release of water from plant leaves), setting the stage for all life to exist. The water cycle is dynamic and naturally variable, and societies and ecosystems are accustomed to functioning within this variability. However, climate change is altering the water cycle in multiple ways over different time scales and geographic areas, presenting unfamiliar risks and opportunities.