This website is the digital version of the 2014 National Climate Assessment, produced in collaboration with the U.S. Global Change Research Program.

For the official version, please refer to the PDF in the downloads section. The downloadable PDF is the official version of the 2014 National Climate Assessment.

Credits | Site Map

Search Options

X

Search form

Top

Welcome to the National Climate Assessment

The National Climate Assessment summarizes the impacts of climate change on the United States, now and in the future.

A team of more than 300 experts guided by a 60-member Federal Advisory Committee produced the report, which was extensively reviewed by the public and experts, including federal agencies and a panel of the National Academy of Sciences.

Explore the effects of climate change
United States Global Change Research Program logo
United States Department of Agriculture logo United States Department of Commerce logo United States Department of Defense logo United States Department of Energy logo United States Department of Health and Human Services logo United States Department of the Interior logo United States Department of State logo United States Department of Transportation logo United States Environmental Protection Agency logo National Aeronautics and Space Administration logo National Science Foundation logo Smithsonian Institution logo United States Agency for International Development logo

Extreme Weather

There have been changes in some types of extreme weather events over the last several decades including in heat waves and cold waves, and regionally, in floods and droughts. Future changes are projected.

Explore extreme weather and climate events.

Next

Convening Lead Authors

John Walsh, University of Alaska Fairbanks

Donald Wuebbles, University of Illinois

Lead Authors

Katharine Hayhoe, Texas Tech University

James Kossin, NOAA, National Climatic Data Center

Kenneth Kunkel, CICS-NC, North Carolina State Univ., NOAA National Climatic Data Center

Graeme Stephens, NASA Jet Propulsion Laboratory

Peter Thorne, Nansen Environmental and Remote Sensing Center

Russell Vose, NOAA National Climatic Data Center

Michael Wehner, Lawrence Berkeley National Laboratory

Josh Willis, NASA Jet Propulsion Laboratory

Contributing Authors

David Anderson, NOAA, National Climatic Data Center

Scott Doney, Woods Hole Oceanographic Institution

Richard Feely, NOAA Pacific Marine Environmental Laboratory

Paula Hennon, CICS-NC, North Carolina State Univ., NOAA National Climatic Data Center

Viatcheslav Kharin, Canadian Centre for Climate Modelling and Analysis, Environment Canada

Thomas Knutson, NOAA Geophysical Fluid Dynamics Laboratory

Felix Landerer, NASA Jet Propulsion Laboratory

Tim Lenton, Exeter University

John Kennedy, UK Meteorological Office

Richard Somerville, Scripps Institution of Oceanography, Univ. of California, San Diego

Introduction

This chapter summarizes how climate is changing, why it is changing, and what is projected for the future. While the focus is on changes in the United States, the need to provide context sometimes requires a broader geographical perspective. Additional geographic detail is presented in the regional chapters of this report. Further details on the topics covered by this chapter are provided in the Climate Science Supplement and Frequently Asked Questions Appendices.

The chapter presents 12 key messages about our changing climate, together with supporting evidence for those messages. The discussion of each key message begins with a summary of recent variations or trends, followed by projections of the corresponding changes for the future.

Key Message 7: Extreme Weather

There have been changes in some types of extreme weather events over the last several decades. Heat waves have become more frequent and intense, especially in the West. Cold waves have become less frequent and intense across the nation. There have been regional trends in floods and droughts. Droughts in the Southwest and heat waves everywhere are projected to become more intense, and cold waves less intense everywhere.

Supporting Evidence
close

Supporting Evidence

Process for Developing Key Messages

Development of the key messages involved discussions of the lead authors and accompanying analyses conducted via one in-person meeting plus multiple teleconferences and email exchanges from February thru September 2012. The authors reviewed 80 technical inputs provided by the public, as well as other published literature, and applied their professional judgment.

Key message development also involved the findings from four special workshops that related to the latest scientific understanding of climate extremes. Each workshop had a different theme related to climate extremes, had approximately 30 attendees (the CMIP5 meeting had more than 100), and the workshops resulted in a paper.18 The first workshop was held in July 2011, titled Monitoring Changes in Extreme Storm Statistics: State of Knowledge.19 The second was held in November 2011, titled Forum on Trends and Causes of Observed Changes in Heatwaves, Coldwaves, Floods, and Drought.10 The third was held in January 2012, titled Forum on Trends in Extreme Winds, Waves, and Extratropical Storms along the Coasts.20 The fourth, the CMIP5 results workshop, was held in March 2012 in Hawai‘i, and resulted in an analysis of CMIP5 results relative to climate extremes in the United States.18

The Chapter Author Team’s discussions were supported by targeted consultation with additional experts. Professional expertise and judgment led to determining “key vulnerabilities.” A consensus-based approach was used for final key message selection.

Description of evidence base

The key message and supporting text summarizes extensive evidence documented in the climate science peer-reviewed literature. Technical Input reports (82) on a wide range of topics were also reviewed; they were received as part of the Federal Register Notice solicitation for public input.

Analysis of U.S. temperature records indicates that record cold events are becoming progressively less frequent relative to record high events.1,2 There is evidence for the corresponding trends in a global framework.3,4 A number of publications have explored the increasing trend of heat waves.3,5,6 Additionally, heat waves observed in the southern Great Plains,7 Europe,3,5 and Russia1,4,8 have now been shown to have a higher probability of having occurred because of human-induced climate change.

Some parts of the U.S. have been seeing changing trends for floods and droughts over the last 50 years, with some evidence for human influence.9,10,5 In the areas of increased flooding in parts of the Great Plains, Midwest, and Northeast, increases in both total precipitation and extreme precipitation have been observed and may be contributing to the flooding increases. However, when averaging over the entire contiguous U.S., there is no overall trend in flood magnitudes.11,12,13,14 A number of publications project drought as becoming a more normal condition over much of the southern and central U.S. (most recent references: Dai 2012; Hoerling et al. 2012; Wehner et al. 201115,16,17).

Analyses of U.S. daily temperature records indicate that low records are being broken at a much smaller rate than high records, and at the smallest rate in the historical record.1,2 However, in certain localized regions, natural variations can be as large or larger than the human induced change.

New information and remaining uncertainties

The key uncertainty regarding projections of future drought is how soil moisture responds to precipitation changes and potential evaporation increases. Most studies indicate that many parts of the U.S. will experience drier soil conditions but the amount of that drying is uncertain.

Natural variability is also an uncertainty affecting projections of extreme event occurrences in shorter timescales (several years to decades), but the changes due to human influence become larger relative to natural variability as the timescale lengthens. Stakeholders should view the occurrence of extreme events in the context of increasing probabilities due to climate change.

Continuation of long term temperature and precipitation observations is critical to monitoring trends in extreme weather events.

Assessment of confidence based on evidence

Given the evidence base and uncertainties, confidence is high for the entire key message.

Heat waves have become more frequent and intense, and confidence is high that heat waves everywhere are projected to become more intense in the future.

Confidence is high that cold waves have become less frequent and intense across the nation.

Confidence is high that there have been regional trends in floods and droughts.

Confidence is high that droughts in the Southwest are projected to become more intense.

Confidence Level

Very High

Strong evidence (established theory, multiple sources, consistent results, well documented and accepted methods, etc.), high consensus

High

Moderate evidence (several sources, some consistency, methods vary and/or documentation limited, etc.), medium consensus

Medium

Suggestive evidence (a few sources, limited consistency, models incomplete, methods emerging, etc.), competing schools of thought

Low

Inconclusive evidence (limited sources, extrapolations, inconsistent findings, poor documentation and/or methods not tested, etc.), disagreement or lack of opinions among experts

Extreme Weather

sunset over city ©Bill Ross/Corbis

Heat waves are periods of abnormally hot weather lasting days to weeks.10 Heat waves have generally become more frequent across the U.S. in recent decades, with western regions (including Alaska) setting records for numbers of these events in the 2000s. Tree ring data suggests that the drought over the last decade in the western U.S. represents the driest conditions in 800 years.7,27 Most other regions in the country had their highest number of short-duration heat waves in the 1930s, when the multi-year severe drought of the Dust Bowl period, combined with deleterious land-use practices,28 contributed to the intense summer heat through depletion of soil moisture and reduction of the moderating effects of evaporation.29 However, the recent prolonged (multi-month) extreme heat has been unprecedented since the start of reliable instrumental records in 1895. The recent heat waves and droughts in Texas (2011) and the Midwest (2012) set records for highest monthly average temperatures, exceeding in some cases records set in the 1930s, including the highest monthly contiguous U.S. temperature on record (July 2012, breaking the July 1936 record) and the hottest summers on record in several states (New Mexico, Texas, Oklahoma, and Louisiana in 2011 and Colorado and Wyoming in 2012). For the spring and summer months, 2012 had the second largest area of record-setting monthly average temperatures, including a 26-state area from Wyoming to the East Coast. The summer (June-August) temperatures of 2012 ranked in the hottest 10% of the 118-year period of record in 28 states covering the Rocky Mountain states, the Great Plains, the Upper Midwest, and the Northeast. The new records included both hot daytime maximum temperatures and warm nighttime minimum temperatures.30 Corresponding with this increase in extreme heat, the number of extreme cold waves has reached the lowest levels on record (since 1895).

farmer examines parched land ©Scott Olson/Getty Images

Many more high temperature records are being broken as compared to low temperature records over the past three to four decades – another indicator of a warming climate.1 The number of record low monthly temperatures has declined to the lowest levels since 1911, while the number of record high monthly temperatures has increased to the highest level since the 1930s. During this same period, there has been an increasing trend in persistently high nighttime temperature.7 There are various reasons why low temperatures have increased more than high temperatures.31,32,33

In some areas, prolonged periods of record high temperatures associated with droughts contribute to dry conditions that are driving wildfires.5 The meteorological situations that cause heat waves are a natural part of the climate system. Thus the timing and location of individual events may be largely a natural phenomenon, although even these may be affected by human-induced climate change.34 However, there is emerging evidence that most of the increases of heat wave severity over the U.S. are likely due to human activity,35 with a detectable human influence in recent heat waves in the southern Great Plains7,36 as well as in Europe3,5 and Russia.1,4,8 The summer 2011 heat wave and drought in Texas was primarily driven by precipitation deficits, but the human contribution to climate change approximately doubled the probability that the heat was record-breaking.37 So while an event such as this Texas heat wave and drought could be triggered by a naturally occurring event such as a deficit in precipitation, the chances for record-breaking temperature extremes has increased and will continue to increase as the global climate warms. Generally, the changes in climate are increasing the likelihood for these types of severe events.

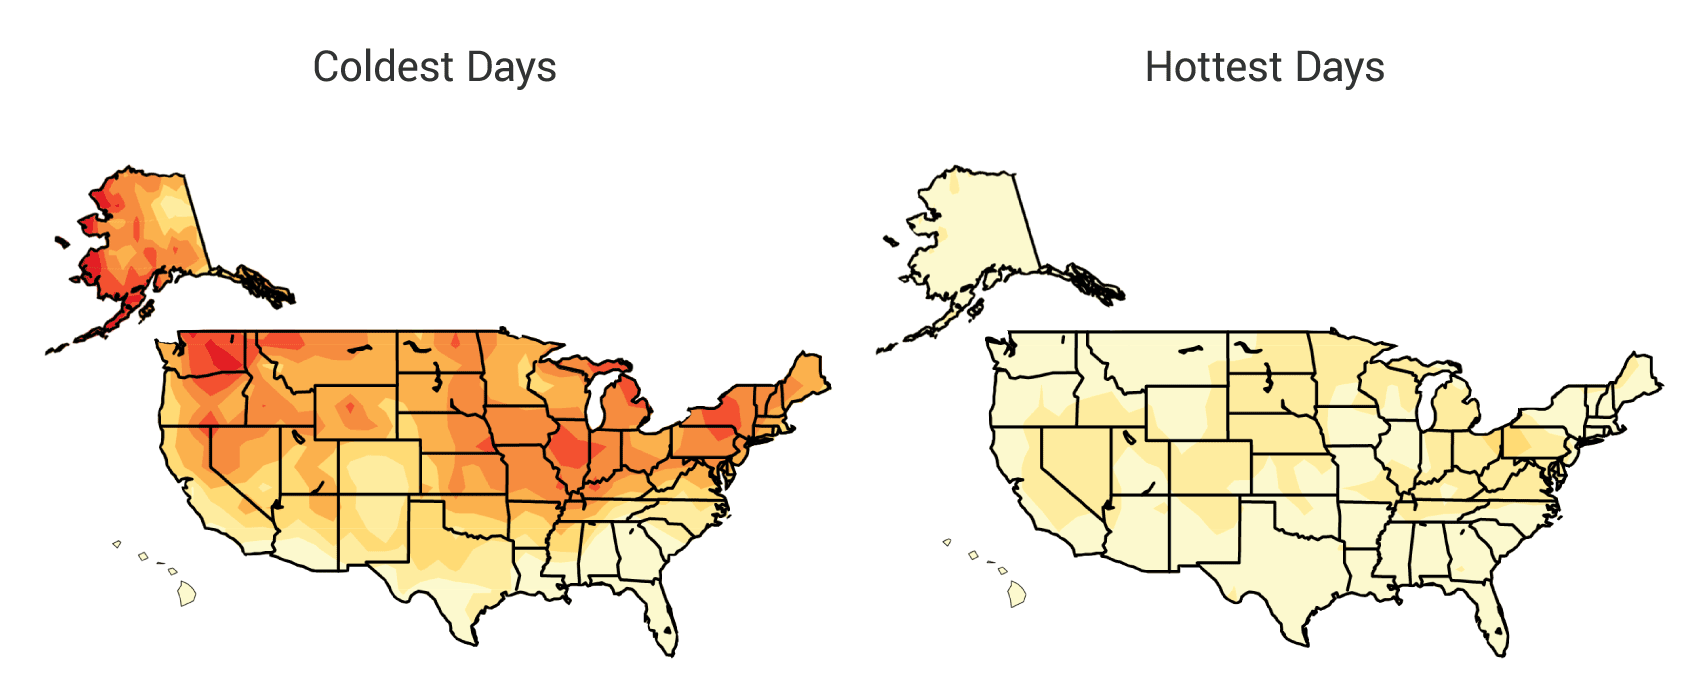
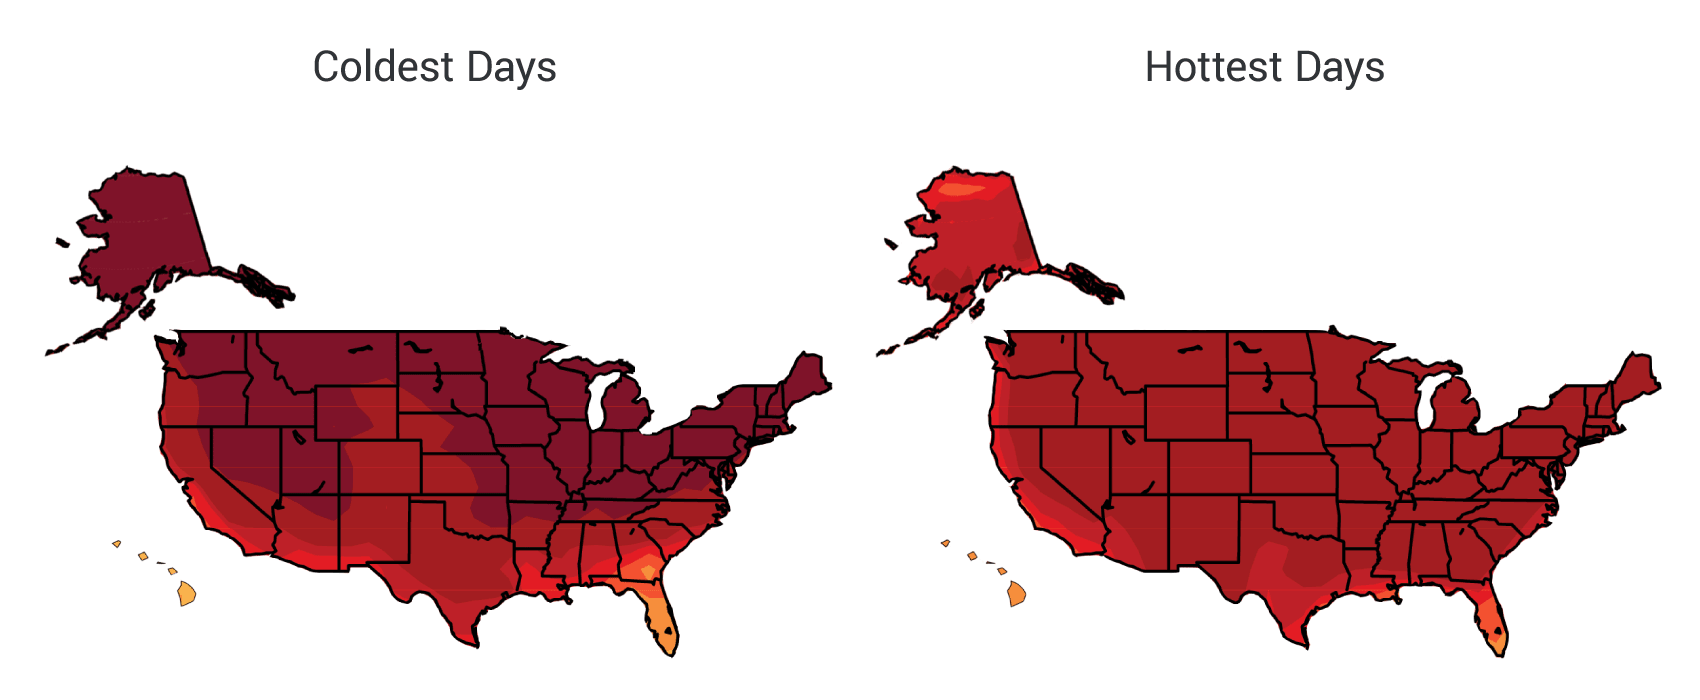
Figure 2.20: Projected Temperature Change of Hottest and Coldest Days

Projected Temperature Change of Hottest and Coldest Days

Rapid Emissions Reductions (RCP 2.6)Continued Emissions Increases (RCP 8.5)

Figure 2.20: Change in surface air temperature at the end of this century (2081-2100) relative to the turn of the last century (1986-2005) on the coldest and hottest days under a scenario that assumes a rapid reduction in heat trapping gases (RCP 2.6) and a scenario that assumes continued increases in these gases (RCP 8.5). This figure shows estimated changes in the average temperature of the hottest and coldest days in each 20-year period. In other words, the hottest days will get even hotter, and the coldest days will be less cold. (Figure source: NOAA NCDC / CICS-NC).

Details/Download

The number of extremely hot days is projected to continue to increase over much of the United States, especially by late century. Summer temperatures are projected to continue rising, and a reduction of soil moisture, which exacerbates heat waves, is projected for much of the western and central U.S. in summer. Climate models project that the same summertime temperatures that ranked among the hottest 5% in 1950-1979 will occur at least 70% of the time by 2035-2064 in the U.S. if global emissions of heat-trapping gases continue to grow (as in the A2 scenario).8 By the end of this century, what have previously been once-in-20-year extreme heat days (1-day events) are projected to occur every two or three years over most of the nation.6,38 In other words, what now seems like an extremely hot day will become commonplace.

There are significant trends in the magnitude of river flooding in many parts of the United States. When averaged over the entire nation, however, the increases and decreases cancel each other out and show no national level trend.11,12,13,14 River flood magnitudes have decreased in the Southwest and increased in the eastern Great Plains, parts of the Midwest, and from the northern Appalachians into New England.10 Figure 2.21 shows increasing trends in floods in green and decreasing trends in brown. The magnitude of these trends is illustrated by the size of the triangles.

Figure 2.21: Trends in Flood Magnitude Trends in Flood Magnitude Details/Download

These regional river flood trends are qualitatively consistent with trends in climate conditions associated with flooding. For example, average annual precipitation has increased in the Midwest and Northeast and decreased in the Southwest (Figure 2.12).10 Recent soil moisture trends show general drying in the Southwest and moistening in the Northeast and northern Great Plains and Midwest (Ch 3: Water Resources, Figure 3.2). These trends are in general agreement with the flood trends. Although there is a strong national upward trend in extreme precipitation and not in river flooding, the regional variations are similar. Extreme precipitation has been increasing strongly in the Great Plains, Midwest, and Northeast, where river flooding increases have been observed, and there is little trend in the Southwest, where river flooding has decreased. An exact correspondence is not necessarily expected since the seasonal timing of precipitation events makes a difference in whether river flooding occurs. The increase in extreme precipitation events has been concentrated in the summer and fall19 when soil moisture is seasonally low and soils can absorb a greater fraction of rainfall. By contrast, many of the annual flood events occur in the spring when soil moisture is high. Thus, additional extreme rainfall events in summer and fall may not create sufficient runoff for the resulting streamflow to exceed spring flood magnitudes. However, these extreme precipitation events are often associated with local flash floods, a leading cause of death due to weather events (see “Flood Factors and Flood Types” in Ch. 3: Water).

Figure 2.22: Projected Changes in Soil Moisture for the Western U.S. Projected Changes in Soil Moisture for the Western U.S. Details/Download

Research into the effects of human-induced climate change on flood events is relatively new. There is evidence of a detectable human influence in recent flooding events in England and Wales9 and in other specific events around the globe during 2011.10 In general, heavier rains lead to a larger fraction of rainfall running off and, depending on the surface conditions, more potential for flooding.

Higher temperatures lead to increased rates of evaporation, including more loss of moisture through plant leaves. Even in areas where precipitation does not decrease, these increases in surface evaporation and loss of water from plants lead to more rapid drying of soils if the effects of higher temperatures are not offset by other changes (such as in wind speed or humidity).39 As soil dries out, a larger proportion of the incoming heat from the sun goes into heating the soil and adjacent air rather than evaporating its moisture, resulting in hotter summers under drier climatic conditions.40 Under higher emissions scenarios, widespread drought is projected to become more common over most of the central and southern United States.27,41,15,16,21,22,23,24,17,25,26

References

  1. Cayan, D. R., T. Das, D. W. Pierce, T. P. Barnett, M. Tyree, and A. Gershunov, 2010: Future dryness in the southwest US and the hydrology of the early 21st century drought. Proceedings of the National Academy of Sciences, 107, 21271-21276, doi:10.1073/pnas.0912391107. URL | Detail

  2. Christidis, N., P. A. Stott, and S. J. Brown, 2011: The role of human activity in the recent warming of extremely warm daytime temperatures. Journal of Climate, 24, 1922-1930, doi:10.1175/2011JCLI4150.1. | Detail

  3. Cook, B. I., R. L. Miller, and R. Seager, 2009: Amplification of the North American “Dust Bowl” drought through human-induced land degradation. Proceedings of the National Academy of Sciences, 106, 4997-5001, doi:10.1073/pnas.0810200106. URL | Detail

  4. Dai, A., 2012: Increasing drought under global warming in observations and models. Nature Climate Change, 3, 52-58, doi:10.1038/nclimate1633. URL | Detail

  5. Duffy, P. B., and C. Tebaldi, 2012: Increasing prevalence of extreme summer temperatures in the U.S. Climatic Change, 111, 487-495, doi:10.1007/s10584-012-0396-6. | Detail

  6. Easterling, D. R., B. Horton, P. D. Jones, T. C. Peterson, T. R. Karl, D. E. Parker, J. M. Salinger, V. Razuvayev, N. Plummer, P. Jamason, and C. K. Folland, 1997: Maximum and minimum temperature trends for the globe. Science, 277, 364-367, doi:10.1126/science.277.5324.364. | Detail

  7. Hirsch, R. M., and K. R. Ryberg, 2012: Has the magnitude of floods across the USA changed with global CO2 levels? Hydrological Sciences Journal, 57, 1-9, doi:10.1080/02626667.2011.621895. URL | Detail

  8. Hoerling, M., M. Chen, R. Dole, J. Eischeid, A. Kumar, J. W. Nielsen-Gammon, P. Pegion, J. Perlwitz, X. - W. Quan, and T. Zhang, 2013: Anatomy of an extreme event. Journal of Climate, 26, 2811–2832, doi:10.1175/JCLI-D-12-00270.1. URL | Detail

  9. Hoerling, M. P., J. K. Eischeid, X. - W. Quan, H. F. Diaz, R. S. Webb, R. M. Dole, and D. R. Easterling, 2012: Is a transition to semi-permanent drought conditions imminent in the Great Plains? Journal of Climate, 25, 8380–8386, doi:10.1175/JCLI-D-12-00449.1. URL | Detail

  10. Karl, T. R., J. T. Melillo, and T. C. Peterson, 2009: Global Climate Change Impacts in the United States. T.R. Karl, Melillo, J.T., and Peterson, T.C., Eds. Cambridge University Press, 189 pp. URL | Detail

  11. Karl, T. R., G. A. Meehl, T. C. Peterson, K. E. Kunkel, W. J. Gutowski, Jr., and D. R. Easterling, 2008: Executive Summary. Weather and Climate Extremes in a Changing Climate. Regions of Focus: North America, Hawaii, Caribbean, and US Pacific Islands. A Report by the U.S. Climate Change Science Program and the Subcommittee on Global Change Research, T.R. Karl, Meehl, G.A., Miller, C.D., Hassol, S.J., Waple, A.M., and Murray, W.L., Eds., 1-9. URL | Detail

  12. Karl, T. R., B. E. Gleason, M. J. Menne, J. R. McMahon, R. R. Heim, Jr., M. J. Brewer, K. E. Kunkel, D. S. Arndt, J. L. Privette, J. J. Bates, P. Y. Groisman, and D. R. Easterling, 2012: U.S. temperature and drought: Recent anomalies and trends. Eos, Transactions, American Geophysical Union, 93, 473-474, doi:10.1029/2012EO470001. URL | Detail

  13. Kharin, V. V., F. W. Zwiers, X. Zhang, and M. Wehner, 2013: Changes in temperature and precipitation extremes in the CMIP5 ensemble. Climatic Change, 119, 345-357, doi:10.1007/s10584-013-0705-8. | Detail

  14. Kunkel, K. E., P. D. Bromirski, H. E. Brooks, T. Cavazos, A. V. Douglas, D. R. Easterling, K. A. Emanuel, P. Y. Groisman, G. J. Holland, T. R. Knutson, J. P. Kossin, P. D. Komar, D. H. Levinson, and R. L. Smith, 2008: Ch. 2: Observed changes in weather and climate extremes. Weather and Climate Extremes in a Changing Climate. Regions of Focus: North America, Hawaii, Caribbean, and U.S. Pacific Islands. A Report by the U.S. Climate Change Science Program and the Subcommittee on Global Change Research, T.R. Karl, Meehl, G.A., Miller, C.D., Hassol, S.J., Waple, A.M., and Murray, W.L., Eds., 35-80. URL | Detail

  15. Kunkel, K. E., L. E. Stevens, S. E. Stevens, L. Sun, E. Janssen, D. Wuebbles, and J. G. Dobson, 2013: Regional Climate Trends and Scenarios for the U.S. National Climate Assessment: Part 9. Climate of the Contiguous United States. NOAA Technical Report NESDIS 142-9. 85 pp., National Oceanic and Atmospheric Administration, National Environmental Satellite, Data, and Information Service, Washington, D.C. URL | Detail

  16. Kunkel, K. E. et al., 2013: Monitoring and understanding trends in extreme storms: State of knowledge. Bulletin of the American Meteorological Society, 94, doi:10.1175/BAMS-D-11-00262.1. URL | Detail

  17. Liang, X., E. F. Wood, and D. P. Lettenmaier, 1996: Surface soil moisture parameterization of the VIC-2L model: Evaluation and modification. Global and Planetary Change, 13, 195-206, doi:10.1016/0921-8181(95)00046-1. | Detail

  18. Liang, X., D. P. Lettenmaier, E. F. Wood, and S. J. Burges, 1994: A simple hydrologically based model of land surface water and energy fluxes for general circulation models. Journal of Geophysical Research, 99, 14415-14428, doi:10.1029/94JD00483. URL | Detail

  19. Maurer, E. P., A. W. Wood, J. C. Adam, D. P. Lettenmaier, and B. Nijssen, 2002: A long-term hydrologically based dataset of land surface fluxes and states for the conterminous United States. Journal of Climate, 15, 3237-3251, doi:10.1175/1520-0442(2002)0152.0.CO;2. URL | Detail

  20. McNider, R. T., G. J. Steeneveld, A. A. M. Holtslag, R. A. Pielke, Sr., S. Mackaro, A. Pour-Biazar, J. Walters, U. Nair, and J. Christy, 2012: Response and sensitivity of the nocturnal boundary layer over land to added longwave radiative forcing. Journal of Geophysical Research, 117, D14106, doi:10.1029/2012JD017578. URL | Detail

  21. Meehl, G. A., C. Tebaldi, G. Walton, D. Easterling, and L. McDaniel, 2009: Relative increase of record high maximum temperatures compared to record low minimum temperatures in the US. Geophysical Research Letters, 36, L23701, doi:10.1029/2009GL040736. URL | Detail

  22. Meehl, G. A., T. F. Stocker, W. D. Collins, P. Friedlingstein, A. T. Gaye, J. M. Gregory, A. Kitoh, R. Knutti, J. M. Murphy, A. Noda, S. C. B. Raper, I. G. Watterson, A. J. Weaver, and Z. - C. Zhao, 2007: Ch. 10: Global climate projections. Climate Change 2007: The Physical Science basis: Contribution of Working Group I to the Fourth Assessment Report of the Intergovernmental Panel on Climate Change, S. Solomon, Qin, D., Manning, M., Chen, Z., Marquis, M., Averyt, K.B., Tignor, M., and Miller, H.L., Eds., Cambridge University Press, 747-845. URL | Detail

  23. Mueller, B., and S. I. Seneviratne, 2012: Hot days induced by precipitation deficits at the global scale. Proceedings of the National Academy of Sciences, 109, 12398-12403, doi:10.1073/pnas.1204330109. URL | Detail

  24. Nijssen, B., D. P. Lettenmaier, X. Liang, S. W. Wetzel, and E. F. Wood, 1997: Streamflow simulation for continental-scale river basins. Water Resources Research, 33, 711-724, doi:10.1029/96WR03517. URL | Detail

  25. Pall, P., T. Aina, D. A. Stone, P. A. Stott, T. Nozawa, A. G. J. Hilberts, D. Lohmann, and M. R. Allen, 2011: Anthropogenic greenhouse gas contribution to flood risk in England and Wales in autumn 2000. Nature, 470, 382-385, doi:10.1038/nature09762. URL | Detail

  26. Peterson, T. C. et al., 2013: Monitoring and understanding changes in heat waves, cold waves, floods and droughts in the United States: State of knowledge. Bulletin of the American Meteorological Society, 94, 821-834, doi:10.1175/BAMS-D-12-00066.1. URL | Detail

  27. Rupp, D. E., P. W. Mote, N. Massey, C. J. Rye, R. Jones, and M. R. Allen, 2012: Did human influence on climate make the 2011 Texas drought more probable? Explaining extreme events of 2011 from a climate perspective. Bulletin of the American Meteorological Society, T.C. Peterson, Stott, P.A., and Herring, S., Eds., 1052-1054. URL | Detail

  28. Schwalm, C. R., C. A. Williams, K. Schaefer, D. Baldocchi, T. A. Black, A. H. Goldstein, B. E. Law, W. C. Oechel, K. T. Paw, and R. L. Scott, 2012: Reduction in carbon uptake during turn of the century drought in western North America. Nature Geoscience, 5, 551-556, doi:10.1038/ngeo1529. URL | Detail

  29. Sheffield, J., E. F. Wood, and M. L. Roderick, 2012: Little change in global drought over the past 60 years. Nature, 491, 435-438, doi:10.1038/nature11575. URL | Detail

  30. Stott, P. A., N. P. Gillett, G. C. Hegerl, D. J. Karoly, D. A. Stone, X. Zhang, and F. Zwiers, 2010: Detection and attribution of climate change: A regional perspective. Wiley Interdisciplinary Reviews: Climate Change, 1, 192-211, doi:10.1002/wcc.34. | Detail

  31. Trenberth, K. E., 2011: Changes in precipitation with climate change. Climate Research, 47, 123-138, doi:10.3354/cr00953. | Detail

  32. Trenberth, K. E., and J. T. Fasullo, 2012: Climate extremes and climate change: The Russian heat wave and other climate extremes of 2010. Journal of Geophysical Research: Atmospheres, 117, D17103, doi:10.1029/2012JD018020. URL | Detail

  33. Villarini, G., and J. A. Smith, 2010: Flood peak distributions for the eastern United States. Water Resources Research, 46, W06504, doi:10.1029/2009wr008395. URL | Detail

  34. Villarini, G., F. Serinaldi, J. A. Smith, and W. F. Krajewski, 2009: On the stationarity of annual flood peaks in the continental United States during the 20th century. Water Resources Research, 45, W08417, doi:10.1029/2008wr007645. URL | Detail

  35. Villarini, G., J. A. Smith, M. Lynn Baeck, and W. F. Krajewski, 2011: Examining flood frequency distributions in the Midwest U.S. JAWRA Journal of the American Water Resources Association, 47, 447-463, doi:10.1111/j.1752-1688.2011.00540.x. URL | Detail

  36. Vose, R. S., D. R. Easterling, and B. Gleason, 2005: Maximum and minimum temperature trends for the globe: An update through 2004. Geophysical Research Letters, 32, L23822, doi:10.1029/2005GL024379. | Detail

  37. Vose, R. S. et al., 2013: Monitoring and understanding changes in extremes: Extratropical storms, winds, and waves. Bulletin of the American Meteorological Society, in press, doi:10.1175/BAMS-D-12-00162.1. URL | Detail

  38. Wehner, M., D. R. Easterling, J. H. Lawrimore, R. R. Heim Jr, R. S. Vose, and B. D. Santer, 2011: Projections of future drought in the continental United States and Mexico. Journal of Hydrometeorology, 12, 1359-1377, doi:10.1175/2011JHM1351.1. URL | Detail

  39. Wood, A. W., and D. P. Lettenmaier, 2006: A test bed for new seasonal hydrologic forecasting approaches in the western United States. Bulletin of the American Meteorological Society, 87, 1699-1712, doi:10.1175/BAMS-87-12-1699. | Detail

  40. Wood, A. W., A. Kumar, and D. P. Lettenmaier, 2005: A retrospective assessment of National Centers for Environmental Prediction climate model–based ensemble hydrologic forecasting in the western United States. Journal of Geophysical Research, 110, 16, doi:10.1029/2004JD004508. | Detail

  41. Wuebbles, D. J., G. Meehl, K. Hayhoe, T. R. Karl, K. Kunkel, B. Santer, M. Wehner, B. Colle, E. M. Fischer, R. Fu, A. Goodman, E. Janssen, H. Lee, W. Li, L. N. Long, S. Olsen, A. J. Sheffield, and L. Sun, 2013: CMIP5 climate model analyses: Climate extremes in the United States. Bulletin of the American Meteorological Society, in press, doi:10.1175/BAMS-D-12-00172.1. URL | Detail

The National Climate Assessment summarizes the impacts of climate change on the United States, now and in the future.

A team of more than 300 experts guided by a 60-member Federal Advisory Committee produced the report, which was extensively reviewed by the public and experts, including federal agencies and a panel of the National Academy of Sciences.

United States Global Change Research Program logo United States Global Change Research Program participating agency logos