This website is the digital version of the 2014 National Climate Assessment, produced in collaboration with the U.S. Global Change Research Program.

For the official version, please refer to the PDF in the downloads section. The downloadable PDF is the official version of the 2014 National Climate Assessment.

Credits | Site Map

Search Options

X

Search form

Top

Welcome to the National Climate Assessment

The National Climate Assessment summarizes the impacts of climate change on the United States, now and in the future.

A team of more than 300 experts guided by a 60-member Federal Advisory Committee produced the report, which was extensively reviewed by the public and experts, including federal agencies and a panel of the National Academy of Sciences.

Explore the effects of climate change
United States Global Change Research Program logo
United States Department of Agriculture logo United States Department of Commerce logo United States Department of Defense logo United States Department of Energy logo United States Department of Health and Human Services logo United States Department of the Interior logo United States Department of State logo United States Department of Transportation logo United States Environmental Protection Agency logo National Aeronautics and Space Administration logo National Science Foundation logo Smithsonian Institution logo United States Agency for International Development logo

Land Use and Land Cover Change

Land-use and land-cover changes affect local, regional, and global climate processes. Choices about land-use and land-cover patterns have affected and will continue to affect our vulnerability to the effects of climate change.

Explore land use and land cover impacts.

Next

Convening Lead Authors

Daniel G. Brown, University of Michigan

Colin Polsky, Clark University

Lead Authors

Paul Bolstad, University of Minnesota

Samuel D. Brody, Texas A&M University at Galveston

David Hulse, University of Oregon

Roger Kroh, Mid-America Regional Council

Thomas R. Loveland, U.S. Geological Survey

Allison Thomson, Pacific Northwest National Laboratory

Introduction

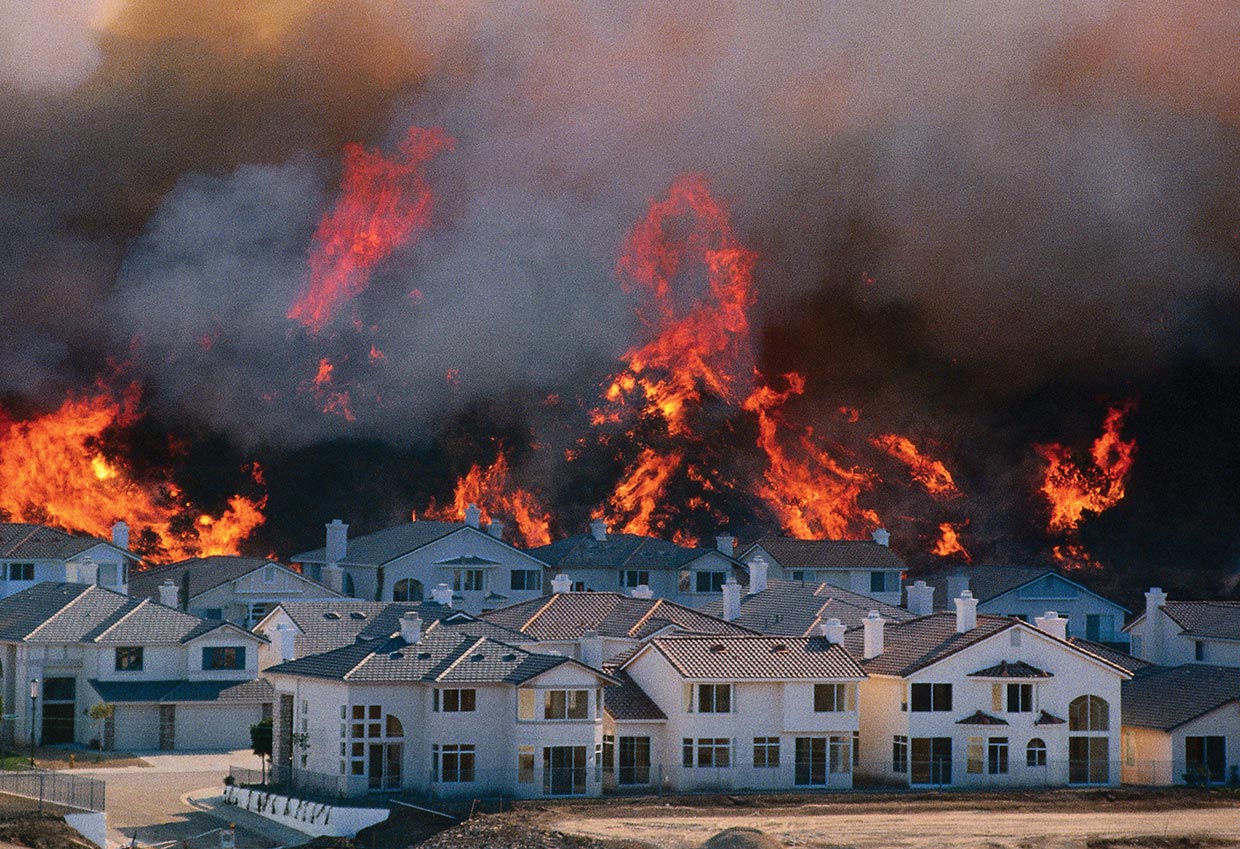
In addition to emissions of heat-trapping greenhouse gases from energy, industrial, agricultural, and other activities, humans also affect climate through changes in land use (activities taking place on land, like growing food, cutting trees, or building cities) and land cover (the physical characteristics of the land surface, including grain crops, trees, or concrete).10 For example, cities are warmer than the surrounding countryside because the greater extent of paved areas in cities affects how water and energy are exchanged between the land and the atmosphere. This increases the exposure of urban populations to the effects of extreme heat events. Decisions about land use and land cover can therefore affect, positively or negatively, how much our climate will change and what kind of vulnerabilities humans and natural systems will face as a result.

development along Front Range

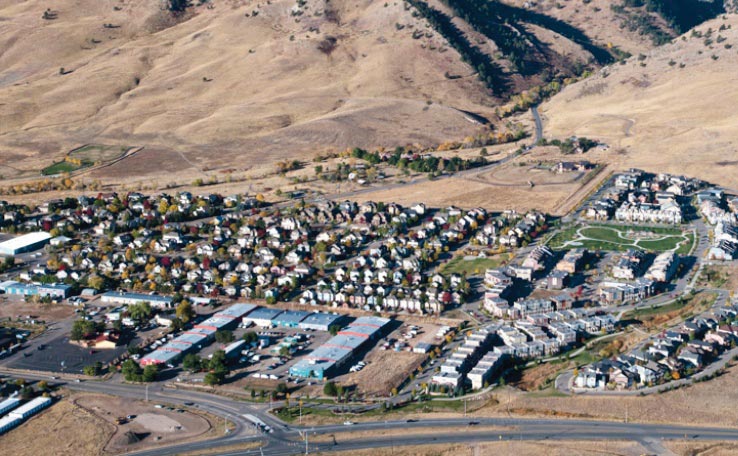
Land-use and land-cover changes affect climate processes. Above, development along Colorado’s Front Range

The impacts of changes in land use and land cover cut across all regions and sectors of the National Climate Assessment. Chapters addressing each region discuss land-use and land-cover topics of particular concern to specific regions. Similarly, chapters addressing sectors examine specific land-use matters. In particular, land cover and land use are a major focus for sectors such as agriculture, forests, rural and urban communities, and Native American lands. By contrast, the key messages of this chapter are national in scope and synthesize the findings of other chapters regarding land cover and land use.

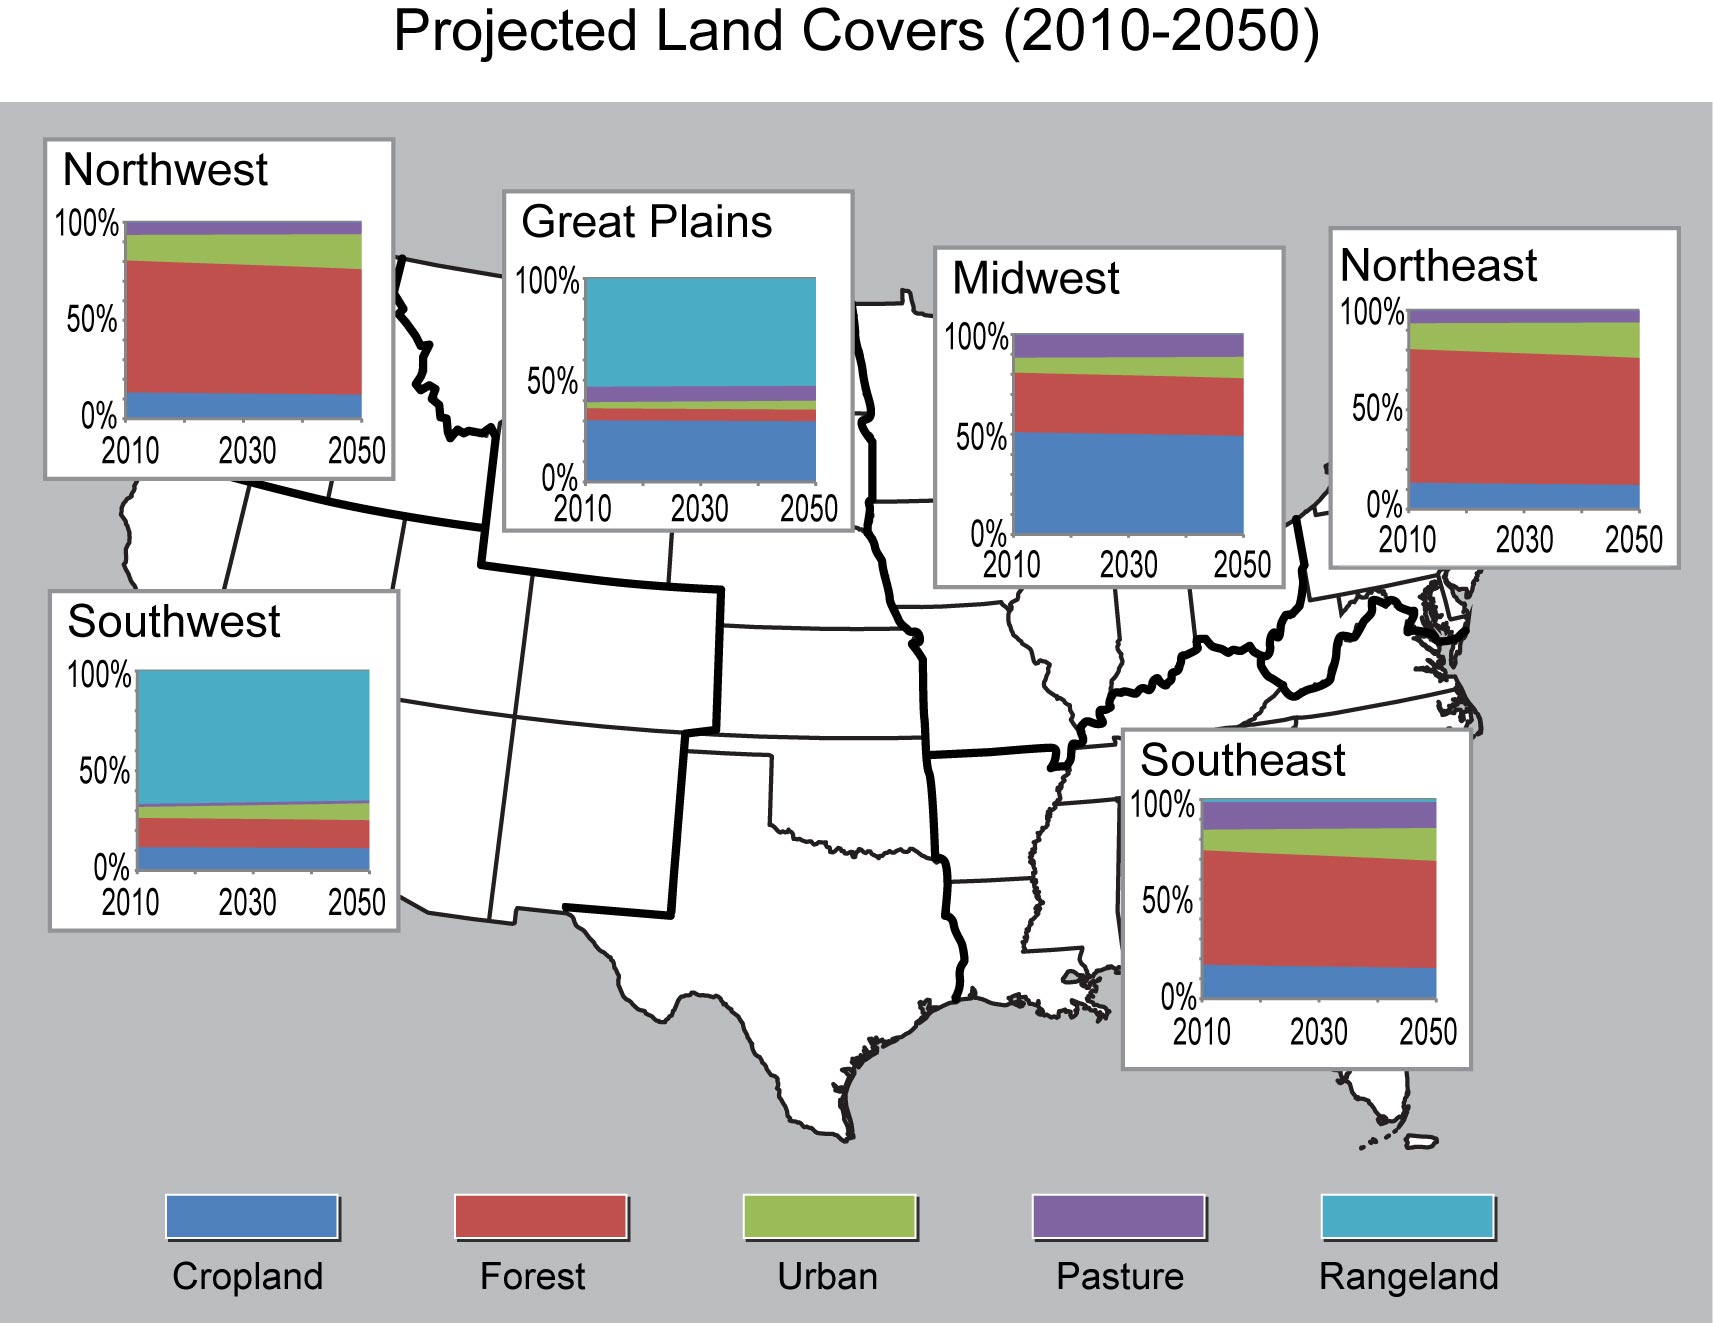
Land uses and land covers change over time in response to evolving economic, social, and biophysical conditions.16 Many of these changes are set in motion by individual landowners and land managers and can be quantified from satellite measurements, aerial photographs, on-the-ground observations, and reports from landowners and users.11,2 Over the past few decades, the most prominent land changes within the U.S. have been changes in the amount and kind of forest cover due to logging practices and development in the Southeast and Northwest and to urban expansion in the Northeast and Southwest.

Because humans control land use and, to a large extent, land cover, individuals, businesses, non-profit organizations, and governments can make land decisions to adapt to and/or reduce the effects of climate change. Often the same land-use decision can serve both aims. Adaptation options (those aimed at coping with the effects of climate change) include varying the local mix of vegetation and concrete to reduce heat in cities or elevating homes to reduce exposure to sea level rise or flooding. Land-use and land-cover-related options for mitigating climate change (reducing the speed and amount of climate change) include expanding forests to accelerate removal of carbon from the atmosphere, modifying the way cities are built and organized to reduce energy and motorized transportation demands, and altering agricultural management practices to increase carbon storage in soil.

Despite this range of climate change response options, there are three main reasons why private and public landowners may choose not to modify land uses and land covers for climate adaptation or mitigation purposes. First, land decisions are influenced not only by climate but also by economic, cultural, legal, or other considerations. In many cases, climate-based land-change efforts to adapt to or reduce climate change meet with resistance because current practices are too costly to modify and/or too deeply entrenched in local societies and cultures. Second, certain land uses and land covers are simply difficult to modify, regardless of desire or intent. For instance, the number of homes constructed in floodplains or the amount of irrigated agriculture can be so deeply rooted that they are difficult to change, no matter how much those practices might impede our ability to respond to climate change. Finally, the benefits of land-use decisions made by individual landowners with specific adaptation or mitigation goals do not always accrue to those landowners or even to their communities. Therefore, without some institutional intervention (such as incentives or penalties), the motivations for such decisions can be weak.

Recent Trends

In terms of land area, the U.S. remains a predominantly rural country, especially as its population increasingly gravitates towards urban areas. In 1910, only 46% of the U.S. population lived in urban areas, but by 2010 that figure had climbed to more than 81%.4,5 In 2006 (the most recent year for which these data are available), more than 80% of the land cover in the lower 48 states was dominated by shrub/scrub vegetation, grasslands, forests, and agriculture.6,1 Forests and grasslands, which include acreage used for timber production and grazing, account for more than half of all U.S. land use by area (Table 13.1), about 63% of which is in private ownership, though their distribution and ownership patterns vary regionally.2 Agricultural land uses are carried out on 18% of U.S. surface area. Developed or built-up areas covered only about 5% of the country’s land surface, with the greatest concentrations of urban areas in the Northeast, Midwest, and Southeast. This apparently small percentage of developed area belies its rapid expansion and does not include development that is dispersed in a mosaic among other land uses (like agriculture and forests). In particular, low-density housing developments (suburban and exurban areas), which are not well-represented in commonly used satellite measurements, have rapidly expanded throughout the U.S. over the last 60 years or so.7,8,9 Based on Census data, areas settled at suburban and exurban densities (1 house per 1 to 40 acres on average) cover more than 15 times the land area settled at urban densities (1 house per acre or less) and covered five times more land area in 2000 than in 1950.7

Figure 13.1: U.S. Land-Cover Composition in 2000

U.S. Land-cover Composition in 2000

NorthwestSouthwestGreat PlainsMidwestNortheastSoutheast
Northwest Southwest Great Plains Southeast Northeast Midwest
Close

Northwest

Close

Southwest

Close

Great Plains

Close

Midwest

Close

Northeast

Close

Southeast

Figure 13.1: Map shows regional differences in land cover. These patterns affect climate and will be affected by climate change. They also influence the vulnerability and resilience of communities to the effects of climate change (Figure source: USGS Earth Resources Observation and Science (EROS) Center). (See Table 13.2 for definitions of mechanically and non-mechanically disturbed.)

Details/Download

Despite these rapid changes in developed land covers, the vast size of the country means that total land-cover changes in the U.S. may appear deceptively modest. Since 1973, satellite data show that the overall rate of land-cover changes nationally has averaged about 0.33% per year. Yet this small rate of change has produced a large cumulative impact. Between 1973 and 2000, 8.6% of the area of the lower 48 states experienced land-cover change, an area roughly equivalent to the combined land area of California and Oregon.10

These national-level annual rates of land changes mask considerable geographic variability in the types, rates, and causes of change.11 Between 1973 and 2000, the Southeast region had the highest rate of change, due to active forest timber harvesting and replanting, while the Southwest region had the lowest rate of change.

Table 13.1: Land Cover Statistics

close
Land Cover Class Northeast Southeast Midwest Great Plains Southwest Northwest Alaska Hawaii United States Land Use Class (ca 2007) United States (ca 2007)
Agriculture 10.9% 23.0% 49.0% 29.7% 5.0% 10.0% 0.0% 4.0% 18.6% Cropland 18.0%
Grassland, Shrub/Scrub, Moss, Lichen 3.4% 7.8% 2.9% 50.5% 65.7% 42.8% 44.9% 33.3% 39.2% Grassland, Pasture, and Range 27.1%
Forest 52.4% 38.7% 23.7% 10.7% 19.9% 37.7% 22.4% 22.0% 23.2%a Forest 29.7%a
Barren 0.8% 0.3% 0.2% 0.5% 3.7% 1.5% 7.7% 11.2% 2.6% Special Useb 13.8%
Developed, Built-Up 9.6% 7.7% 8.0% 4.0% 2.7% 3.0% 0.1% 6.7% 4.0% Urban 2.7%
Water, Ice, Snow 14.9% 7.3% 10.4% 1.9% 1.7% 3.2% 18.5% 21.7% 7.4% Miscellaneousc 8.7%
Wetlands 8.0% 15.2% 5.8% 2.7% 0.7% 1.3% 6.4% 0.3% 5.0%    

Table 13.1: Circa-2001 land-cover statistics for the National Climate Assessment regions of the United States based on the National Land Cover Dataset,1 and overall United States land-use statistics—circa 2007.2

  a Differences in the way certain categories are defined, such as the special uses distinction in the USDA Economic Research Service land use estimates, make direct comparisons between land use and land cover challenging. For example, forest land use (29.7%) exceeds forest cover (23.2%). Forest use definitions include lands where trees have been harvested and may be replanted, while forest cover is a measurement of the presence of trees.

b Special uses represent rural transportation, rural parks and wildlife, defense and industrial, plus miscellaneous farm and other special uses.

c Miscellaneous uses represent unclassified uses such as marshes, swamps, bare rock, deserts, and tundra plus other uses not estimated, classified, or inventoried.

Table 13.2: Percent Change in Land Cover

close
Land Cover Type Northeast Southeast Midwest Great Plains Southwest Northwest
Grassland/Shrubland 0.73 0.31 0.59 1.55 -0.28 0.35
Forest -2.02 -2.51 -0.93 -0.71 -0.49 2.39
Agriculture -0.85 -1.62 -1.38 -1.60 -0.37 -0.35
Developed 1.36 2.28 1.34 0.43 0.51 0.51
Mining 0.14 -0.05 0.02 0.07 0.10 0.03
Barren 0.00 -0.01 0.00 0.00 0.00 0.00
Snow/Ice 0.00 0.00 0.00 0.00 0.00 0.00
Water 0.03 0.45 0.08 0.23 0.03 -0.02
Wetland -0.05 -0.69 -0.05 -0.13 -0.02 0.03
Mechanically Disturbeda 0.66 1.76 0.32 0.11 0.07 0.07
Non-mechanically Disturbedb 0.00 0.07 0.01 0.06 0.46 1.78

Table 13.2: Percentage change in land-cover type between 1973 and 2000 for the contiguous U.S. National Climate Assessment regions. These figures do not indicate the total amount of changes that have occurred, for example when increases in forest cover were offset by decreases in forest cover, and when cropland taken out of production was offset by other land being put into agricultural production. Data from USGS Land Cover Trends Project; Sleeter et al. 2013.3

a Land in an altered and often un-vegetated state that, because of disturbances by mechanical means, is in transition from one cover type to another. Mechanical disturbances include forest clear-cutting, earthmoving, scraping, chaining, reservoir drawdown, and other similar human-induced changes.

b Land in an altered and often un-vegetated state that because of disturbances by non-mechanical means is in transition from one cover type to another. Non-mechanical disturbances are caused by fire, wind, floods, animals, and other similar phenomena.

Projections

Future patterns of land use and land cover will interact with climate changes to affect human communities and ecosystems. At the same time, future climate changes will also affect how and where humans live and use land for various purposes.

National-scale analyses suggest that the general historical trends of land-use and land-cover changes (described above) will continue, with some important regional differences. These projections all assume continued population growth based on assumed or statistically modeled rates of birth, death, and migration,12 which will result in changes in land use and land cover that are spread unevenly across the country. Urban land covers are projected to increase in the lower 48 states by 73% to 98% (to between 10% and 12% of land area versus less than 6% in 1997) by 2050, using low versus high growth assumptions, respectively. The slowest rate of increase is in the Northeast region, because of the high level of existing development and relatively low rates of population growth, and the highest rate is in the Northwest. In terms of area, the Northwest has the smallest projected increase in urban area (approximately 4.2 million acres) and the Southeast the largest (approximately 27.5 million acres).13

Figure 13.2: Projections of Settlement Densities (2010-2050) Projections of Settlement Densities (2010-2050) Details/Download

Changes in development density will have an impact on how population is distributed and affects land use and land cover. Some of the projected changes in developed areas will depend on assumptions about changes in household size and how concentrated urban development will be. Higher population density means less land is converted from forests or grasslands, but results in a greater extent of paved area. Projections based on estimates of housing-unit density allow the assessment of impacts of urban land-use growth by density class. Increases in low-density exurban areas will result in a greater area affected by development and are expected to increase commuting times and infrastructure costs. The areas projected to experience exurban development will have less density of impervious surfaces (like asphalt or concrete). While about one-third of exurban areas are covered by impervious surfaces,14 urban or suburban areas are about one-half concrete and asphalt. Impervious surfaces have a wide range of environmental impacts and thus represent a key means by which developed lands modify the movement of water, energy, and living things. For example, areas with more impervious surfaces like parking lots and roads tend to experience more rapid runoff, greater risk of flooding, and higher temperatures from the urban heat-island effect.

Figure 13.3: Projected Land Covers (2010-2050) Projected Land Covers (2010-2050) Details/Download

Projections of both land-use and land-cover changes will depend to some degree on rates of population and economic growth. In general, scenarios that assume continued high growth produce more rapid increases in developed areas of all densities and in areas covered by impervious surfaces (paved areas and buildings) by 2050.13,14 Land-use scenarios project that exurban and suburban areas will expand nationally by 15% to 20% between 2000 and 2050,14 based on high- and low-growth scenarios respectively. Land-cover projections by Wear13 show that both cropland and forest are projected to decline most relative to 1997 (by 6% to 7%, respectively, by 2050) under a scenario of high population and economic growth and least (by 4% and 6%, respectively) under lower-growth scenarios. More forest than cropland is projected to be lost in the Northeast and Southeast, whereas more cropland than forest is projected to be lost in the Midwest and Great Plains.15 Some of these regional differences are due to the current mix of land uses, others to the differential rates of urbanization in these different regions.

Key Message 1: Effects on Communities and Ecosystems

Choices about land-use and land-cover patterns have affected and will continue to affect how vulnerable or resilient human communities and ecosystems are to the effects of climate change.

Supporting Evidence
close

Supporting Evidence

Process for Developing Key Messages:

The author team benefited from a number of relevant technical input reports. One report described the findings of a three-day workshop held from November 29 to December 1, 2011, in Salt Lake City, in which a number of the chapter authors participated.16 Findings of the workshop provided a review of current issues and topics as well as the availability and quality of relevant data. In addition, from December 2011 through June 2012 the author team held biweekly teleconferences. Key messages were identified during this period and discussed in two phases, associated with major chapter drafts. An early draft identified a number of issues and key messages. Based on discussions with National Climate Assessment (NCA) leadership and other chapter authors, the Land Use and Land Cover Change authors identified and reached consensus on a final set of four key messages and organized most of the chapter to directly address these messages. The authors selected key messages based on the consequences and likelihood of impacts, the implied vulnerability, and available evidence. Relevance to decision support, mitigation, and adaptation was also an important criterion for the selection of key messages for the cross-cutting and foundational topic of this chapter.

The U.S. acquires, produces, and distributes substantial data that characterize the nation’s land cover and land use. Satellite observations, with near complete coverage over the landscape and consistency for estimating change and trends, are particularly valuable. Field inventories, especially of agriculture and forestry, provide very reliable data products that describe land cover as well as land-use change. Together, remote sensing and field inventory data, as well as related ecological and socioeconomic data, allow many conclusions about land-use and land-cover change with very high confidence.

Description of evidence base

The influences of climate on vegetation and soils, and thus on land cover and land use, are relatively well understood, and a number of well-validated mathematical models are used to investigate potential consequences of climate change for ecosystem processes, structure, and function. Given scenarios about socioeconomic factors or relevant models, some aspects of land-use and land-cover change can also be analyzed and projected into the future based on assumed climate change. During a workshop convened to review land-use and land-cover change for the NCA, participants summarized various studies from different perspectives, including agriculture and forestry as well as socioeconomic issues such as flood insurance.16

Residential exposure to wildfire is an excellent example supporting this key message and is well documented in the literature.17,18,19,20

New information and remaining uncertainties

Steadily accumulating field and remote sensing observations as well as inventories continue to increase confidence in this key message. A recent study by the EPA14 provides relevant projections of housing density and impervious surface under alternative scenarios of climate change.

While there is little uncertainty about the general applicability of this key message, the actual character and consequences of climate change as well as its interactions with land cover and land use vary significantly between locations and circumstances. Thus the specific vulnerabilities resulting from the specific ways in which people, both as individuals and as collectives, will respond to anticipated or observed climate change impacts are less well understood than the biophysical dimensions of this problem.

Assessment of confidence based on evidence

Very High. Observed weather and climate impacts and consequences for land cover and land use, basic understanding of processes and analyses using models of those processes, as well as substantial literature are consistent in supporting this key message.

Confidence Level

Very High

Strong evidence (established theory, multiple sources, consistent results, well documented and accepted methods, etc.), high consensus

High

Moderate evidence (several sources, some consistency, methods vary and/or documentation limited, etc.), medium consensus

Medium

Suggestive evidence (a few sources, limited consistency, models incomplete, methods emerging, etc.), competing schools of thought

Low

Inconclusive evidence (limited sources, extrapolations, inconsistent findings, poor documentation and/or methods not tested, etc.), disagreement or lack of opinions among experts

Effects on Communities and Ecosystems

Decisions about land-use and land-cover change by individual landowners and land managers are influenced by demographic and economic trends and social preferences, which unfold at global, national, regional, and local scales. Policymakers can directly affect land use and land cover. For example, Congress can declare an area as federally protected wilderness, or local officials can set aside portions of a town for industrial development and create tax benefits for companies to build there. Climate factors typically play a secondary role in land decisions, if they are considered at all. Nonetheless, land-change decisions may affect the vulnerabilities of individuals, households, communities, businesses, non-profit organizations, and ecosystems to the effects of climate change.21,22 A farmer’s choice of crop rotation in response to price signals affects his or her farm income’s susceptibility to drought, for example. Such choices, along with changes in climate can also affect the farm’s demand for water for irrigation. Similarly, a developer’s decision to build new homes in a floodplain may affect the new homeowners’ vulnerabilities to flooding events. A decision to include culverts underneath a coastal roadway may facilitate migration of a salt marsh inland as sea level rises.

Figure 13.4: Building Loss by Fires at California Wildland-Urban Interfaces

Building Loss by Fires at California Wildland-Urban Interfaces

Figure 13.4: Many forested areas in the U.S. have experienced a recent building boom in what is known as the “wildland-urban interface.” This figure shows the number of buildings lost from the 25 most destructive wildland-urban interface fires in California history from 1960 to 2007 (Figure source: Stephens et al. 200919).

Details/Download

wildfires

Construction near forests and wildlands is growing. Here wildfire approaches a housing development.

The combination of residential location choices with wildfire occurrence dramatically illustrates how the interactions between land use and climate processes can affect climate change impacts and vulnerabilities. Low-density (suburban and exurban) housing patterns in the U.S. have expanded and are projected to continue to expand.14 One result is a rise in the amount of construction in forests and other wildlands17,18 that in turn has increased the exposure of houses, other structures, and people to damages from wildfires, which are increasing. The number of buildings lost in the 25 most destructive fires in California history increased significantly in the 1990s and 2000s compared to the previous three decades.19 These losses are one example of how changing development patterns can interact with a changing climate to create dramatic new risks. In the western United States, increasing frequencies of large wildfires and longer wildfire durations are strongly associated with increased spring and summer temperatures and an earlier spring snowmelt.20 The effects on property loss of increases in the frequency and sizes of fires under climate change are also projected to increase in the coming decades because so many more people will have moved into increasingly fire-prone places (Ch. 2: Our Changing Climate; Ch. 7: Forests).

Key Message 2: Effects on Climate Processes

Land-use and land-cover changes affect local, regional, and global climate processes.

Supporting Evidence
close

Supporting Evidence

Process for Developing Key Messages:

The author team benefited from a number of relevant technical input reports. One report described the findings of a three-day workshop held from November 29 to December 1, 2011, in Salt Lake City, in which a number of the chapter authors participated.16 Findings of the workshop provided a review of current issues and topics as well as the availability and quality of relevant data. In addition, from December 2011 through June 2012 the author team held biweekly teleconferences. Key messages were identified during this period and discussed in two phases, associated with major chapter drafts. An early draft identified a number of issues and key messages. Based on discussions with National Climate Assessment (NCA) leadership and other chapter authors, the Land Use and Land Cover Change authors identified and reached consensus on a final set of four key messages and organized most of the chapter to directly address these messages. The authors selected key messages based on the consequences and likelihood of impacts, the implied vulnerability, and available evidence. Relevance to decision support, mitigation, and adaptation was also an important criterion for the selection of key messages for the cross-cutting and foundational topic of this chapter.

The U.S. acquires, produces, and distributes substantial data that characterize the nation’s land cover and land use. Satellite observations, with near complete coverage over the landscape and consistency for estimating change and trends, are particularly valuable. Field inventories, especially of agriculture and forestry, provide very reliable data products that describe land cover as well as land-use change. Together, remote sensing and field inventory data, as well as related ecological and socioeconomic data, allow many conclusions about land-use and land-cover change with very high confidence.

Description of evidence base

The dependence of weather and climate processes on land surface properties is reasonably well understood in terms of the biophysical processes involved. Most climate models represent land-surface conditions and processes, though only recently have they begun to incorporate these conditions dynamically to represent changes in the land surface within a model run. Regional weather models are increasingly incorporating land surface characteristics. Extensive literature – as well as textbooks – documents this understanding, as do models of land surface processes and properties. A Technical Input report to the National Climate Assessment10 summarizes the literature and basic understanding of interactions between the atmosphere and land surface that influence climate.

Examples are provided within the chapter to demonstrate that land-use and land-cover change are affecting U.S. climate.23,24,25,26,27,28,29,30,31,32,33

New information and remaining uncertainties

While there is little uncertainty about this key message in general, the heterogeneity of the U.S. landscape and associated processes, as well as regional and local variations in atmospheric processes, make it difficult to analyze or predict the character of land use and land cover influences on atmospheric processes at all scales.

Assessment of confidence based on evidence

Very High. The basic processes underlying the biophysics of interactions between the land surface and atmosphere are well understood. A number of examples and field studies are consistent in demonstrating effects of land use and land-cover change on the climate of the United States.

Confidence Level

Very High

Strong evidence (established theory, multiple sources, consistent results, well documented and accepted methods, etc.), high consensus

High

Moderate evidence (several sources, some consistency, methods vary and/or documentation limited, etc.), medium consensus

Medium

Suggestive evidence (a few sources, limited consistency, models incomplete, methods emerging, etc.), competing schools of thought

Low

Inconclusive evidence (limited sources, extrapolations, inconsistent findings, poor documentation and/or methods not tested, etc.), disagreement or lack of opinions among experts

Effects on Climate Processes

Land use and land cover play critical roles in the interaction between the land and the atmosphere, influencing climate at local, regional, and global scales.34 There is growing evidence that land use, land cover, and land management affect the U.S. climate in several ways:

  • Air temperature and near-surface moisture are changed in areas where natural vegetation is converted to agriculture.23,35 This effect has been observed in the Great Plains and the Midwest, where overall dew point temperatures or the frequency of occurrences of extreme dew point temperatures have increased due to converting land to agricultural use.35,36,37,38 This effect has also been observed where the fringes of California’s Central Valley are being converted from natural vegetation to agriculture.24 Other areas where uncultivated and conservation lands are being returned to cultivation, for example from restored grassland into biofuel production, have also experienced temperature shifts. Regional daily maximum temperatures were lowered due to forest clearing for agriculture in the Northeast and Midwest, and then increased in the Northeast following regrowth of forests due to abandonment of agriculture.25
  • Conversion of rain-fed cropland to irrigated agriculture further intensifies the impacts of agricultural conversion on temperature. For example, irrigation in California has been found to reduce daily maximum temperatures by up to 9°F.39 Model comparisons suggest that irrigation cools temperatures directly over croplands in California’s Central Valley by 5°F to 13°F and increases relative humidity by 9% to 20%.26 Observational data-based studies found similar impacts of irrigated agriculture in the Great Plains.36,40
  • Both observational and modeling studies show that introduction of irrigated agriculture can alter regional precipitation.41,42,43,44 It has been shown that irrigation in the Ogallala aquifer portion of the Great Plains can affect precipitation as far away as Indiana and western Kentucky.42
  • Urbanization is having significant local impacts on weather and climate. Land-cover changes associated with urbanization are creating higher air temperatures compared to the surrounding rural area.27,28,29,30,31 This is known as the “urban heat island” effect (see Ch. 9: Human Health). Urban landscapes are also affecting formation of convective storms and changing the location and amounts of precipitation compared to pre-urbanization.29,32
  • Land-use and land-cover changes are affecting global atmospheric concentrations of greenhouse gases. The impact is expected to be most significant in areas with forest loss or gain, where the amount of carbon that can be transferred from the atmosphere to the land (or from the land to the atmosphere) is modified. Even in relatively un-forested areas, this effect can be significant. A recent USGS report suggests that from 2001 to 2005 in the Great Plains between 22 to 106 million metric tons of carbon were stored in the biosphere due to changes in land use and climate.33 Even with these seemingly large numbers, U.S. forests absorb only 7% to 24% (with a best estimate of 16%) of fossil fuel CO2 emissions (see Ch. 15: Biogeochemical Cycles, “Estimating the U.S. Carbon Sink”).

Key Message 3: Adapting to Climate Change

Individuals, businesses, non-profits, and governments have the capacity to make land-use decisions to adapt to the effects of climate change.

Supporting Evidence
close

Supporting Evidence

Process for Developing Key Messages:

The author team benefited from a number of relevant technical input reports. One report described the findings of a three-day workshop held from November 29 to December 1, 2011, in Salt Lake City, in which a number of the chapter authors participated.16 Findings of the workshop provided a review of current issues and topics as well as the availability and quality of relevant data. In addition, from December 2011 through June 2012 the author team held biweekly teleconferences. Key messages were identified during this period and discussed in two phases, associated with major chapter drafts. An early draft identified a number of issues and key messages. Based on discussions with National Climate Assessment (NCA) leadership and other chapter authors, the Land Use and Land Cover Change authors identified and reached consensus on a final set of four key messages and organized most of the chapter to directly address these messages. The authors selected key messages based on the consequences and likelihood of impacts, the implied vulnerability, and available evidence. Relevance to decision support, mitigation, and adaptation was also an important criterion for the selection of key messages for the cross-cutting and foundational topic of this chapter.

The U.S. acquires, produces, and distributes substantial data that characterize the nation’s land cover and land use. Satellite observations, with near complete coverage over the landscape and consistency for estimating change and trends, are particularly valuable. Field inventories, especially of agriculture and forestry, provide very reliable data products that describe land cover as well as land-use change. Together, remote sensing and field inventory data, as well as related ecological and socioeconomic data, allow many conclusions about land-use and land-cover change with very high confidence.

Description of evidence base

The key message is supported by well-understood aspects of land-use planning and management, including the legal roles of government and citizens and management practices such as zoning and taxation. Participants in the NCA workshop (Nov 29-Dec 1, 2011, in Salt Lake City) on land use and land cover presented and discussed a number of examples showing the influences of land-use decisions on climate change adaptation options.16 The chapter describes specific examples of measures to adapt to climate change, further supporting this key message.45,46,47

New information and remaining uncertainties

Experience with climate change adaptation measures involving land-use decisions is accumulating rapidly.45,46,47

Although there is little uncertainty that land-use decisions can enable adaptation to climate change, the information about climate change, at scales where such decisions are made, is generally lacking.

Assessment of confidence based on evidence

Very High. The aspects of land-use planning that can enable climate change adaptation are well understood and examples demonstrate where actions are being taken.

Confidence Level

Very High

Strong evidence (established theory, multiple sources, consistent results, well documented and accepted methods, etc.), high consensus

High

Moderate evidence (several sources, some consistency, methods vary and/or documentation limited, etc.), medium consensus

Medium

Suggestive evidence (a few sources, limited consistency, models incomplete, methods emerging, etc.), competing schools of thought

Low

Inconclusive evidence (limited sources, extrapolations, inconsistent findings, poor documentation and/or methods not tested, etc.), disagreement or lack of opinions among experts

Adapting to Climate Change

Land-use and land-cover patterns may be modified to adapt to anticipated or observed effects of a changed climate. These changes may be either encouraged or mandated by government (whether at federal or other levels), or undertaken by private initiative. In the U.S., even though land-use decisions are highly decentralized and strongly influenced by Constitutional protection of private property, the Supreme Court has also defined a role for government input into some land-use decisions.48 Thus on the one hand farmers may make private decisions to plant different crops in response to changing growing conditions and/or market prices. On the other hand, homeowners may be compelled to respond to policies, zoning, or regulations (at national, state, county, or municipal levels) by elevating their houses to reduce flood impacts associated with more intense rainfall events and/or increased impervious surfaces.

Land-use and land-cover changes are thus rarely the product of a single factor. Land-use decision processes are influenced not only by the biophysical environment, but also by markets, laws, technology, politics, perceptions, and culture. Yet there is evidence that climate adaptation considerations are playing an increasingly large role in land decisions, even in the absence of a formal federal climate policy. Motivations typically include avoiding or reducing negative impacts from extreme weather events (such as storms or heat waves) or from slow-onset hazards (such as sea level rise) (see Ch. 12: Indigenous Peoples).

For example, New Orleans has, through a collection of private and public initiatives, rebuilt some of the neighborhoods damaged by Hurricane Katrina with housing elevated six feet or even higher above the ground and with roofs specially designed to facilitate evacuation.45 San Francisco has produced a land-use plan to reduce impacts from a rising San Francisco Bay.46 A similar concern has prompted collective action in four Miami-area counties and an array of San Diego jurisdictions, to name just two locales, to shape future land uses to comply with regulations linked to sea level rise projections.45,47 Chicago has produced a plan for limiting the number of casualties, especially among the elderly and homeless, during heat waves (Ch. 9: Human Health).45 Deeper discussion of the factors commonly influencing adaptation decisions at household, municipal, state, and federal levels is provided in Chapter 28 (Ch. 28: Adaptation) of this report; Chapters 26 (Ch. 26: Decision Support) and 27 (Ch. 27: Mitigation) treat the related topics of Decision Support and Mitigation, respectively.

Key Message 4: Reducing Greenhouse Gas Levels

Choices about land use and land management may provide a means of reducing atmospheric greenhouse gas levels.

Supporting Evidence
close

Supporting Evidence

Process for Developing Key Messages:

The author team benefited from a number of relevant technical input reports. One report described the findings of a three-day workshop held from November 29 to December 1, 2011, in Salt Lake City, in which a number of the chapter authors participated.16 Findings of the workshop provided a review of current issues and topics as well as the availability and quality of relevant data. In addition, from December 2011 through June 2012 the author team held biweekly teleconferences. Key messages were identified during this period and discussed in two phases, associated with major chapter drafts. An early draft identified a number of issues and key messages. Based on discussions with National Climate Assessment (NCA) leadership and other chapter authors, the Land Use and Land Cover Change authors identified and reached consensus on a final set of four key messages and organized most of the chapter to directly address these messages. The authors selected key messages based on the consequences and likelihood of impacts, the implied vulnerability, and available evidence. Relevance to decision support, mitigation, and adaptation was also an important criterion for the selection of key messages for the cross-cutting and foundational topic of this chapter.

The U.S. acquires, produces, and distributes substantial data that characterize the nation’s land cover and land use. Satellite observations, with near complete coverage over the landscape and consistency for estimating change and trends, are particularly valuable. Field inventories, especially of agriculture and forestry, provide very reliable data products that describe land cover as well as land-use change. Together, remote sensing and field inventory data, as well as related ecological and socioeconomic data, allow many conclusions about land-use and land-cover change with very high confidence.

Description of evidence base

The evidence base for this key message includes scientific studies on the carbon cycle at both global and local scales (summarized in Izzauralde et al. 2013; Hurteau 2013; and Cambardella and Hatfield 2013).49,50,51 The evidence base also includes policy studies on the costs and benefits and feasibilities of various actions to reduce carbon emissions from land-based activities and/or to increase carbon storage in the biosphere through land-based activities (summarized in Jones et al. 2013; and Pearson and Brown 2013).52,53 Foundational studies are summarized in the NCA Technical Input documents.10,16

New information and remaining uncertainties

A major study by the U.S. Geological Survey is estimating carbon stocks in vegetation and soils of the U.S., and this inventory will clarify the potential for capturing greenhouse gasses by land-use change (an early result is reported in Sohl et al. 201215).

There is little uncertainty behind the premise that specific land uses affect the carbon cycle. There are, however, scientific uncertainties regarding the magnitudes of effects resulting from specific actions designed to leverage this linkage for mitigation. For example, uncertainties are introduced regarding the permanence of specific land-based stores of carbon, the incremental value of specific management or policy decisions to increase terrestrial carbon stocks beyond changes that would have occurred in the absence of management, and the possibility for decreases in carbon storage in another location that offset increases resulting from specific actions at a given location. Also, we do not yet know how natural processes might alter the amount of carbon storage expected to occur with management actions. There are further uncertainties regarding the political feasibilities and economic efficacy of policy options to use land-based activities to reduce the concentration of greenhouse gases in the atmosphere.

Assessment of confidence based on evidence

Given the evidence base and uncertainties, there ismedium confidence that land use and land management choices can reduce the amount of greenhouse gases in the atmosphere.

Confidence Level

Very High

Strong evidence (established theory, multiple sources, consistent results, well documented and accepted methods, etc.), high consensus

High

Moderate evidence (several sources, some consistency, methods vary and/or documentation limited, etc.), medium consensus

Medium

Suggestive evidence (a few sources, limited consistency, models incomplete, methods emerging, etc.), competing schools of thought

Low

Inconclusive evidence (limited sources, extrapolations, inconsistent findings, poor documentation and/or methods not tested, etc.), disagreement or lack of opinions among experts

Reducing Greenhouse Gas Levels

Choices about land use and land management affect the amount of greenhouse gases entering and leaving the atmosphere and, therefore, provide opportunities to reduce climate change (Ch. 15: Biogeochemical Cycles; Ch. 27: Mitigation).54 Such choices can affect the balance of these gases directly, through decisions to preserve or restore carbon in standing vegetation (like forests) and soils, and indirectly, in the form of land-use policies that affect fossil fuel emissions by influencing energy consumption for transportation and in buildings. Additionally, as crops are increasingly used to make fuel, the potential for reducing net carbon emissions through replacement of fossil fuels represents a possible land-based carbon emissions reduction strategy, albeit one that is complicated by many natural and economic interactions that will determine the ultimate effect of these strategies on emissions (Ch. 7: Forests; Ch. 6: Agriculture).

Land-cover change and management accounts for about one-third of all carbon released into the atmosphere by people globally since 1850. The primary source related to land use has been the conversion of native vegetation like forests and grasslands to croplands, which in turn has released carbon from vegetation and soil into the atmosphere as carbon dioxide (CO2).55 Currently, an estimated 16% of CO2 going into the atmosphere is due to land-related activities globally, with the remainder coming from fossil fuel burning and cement manufacturing.55 In the United States, activities related to land use are effectively balanced with respect to CO2: as much CO2 is released to the atmosphere by land-use activities as is taken up by and stored in, for example, vegetation and soil. The regrowth of forests and increases of conservation-related forest and crop management practices have also increased carbon storage. Overall, setting aside emissions due to burning fossil fuels, in the U.S. and the rest of North America, land cover takes up more carbon than it releases. This has happened as a result of more efficient forest and agricultural management practices, but it is not clear if this rate of uptake can be increased or if it will persist into the future. The projected declines in forest area (Figure 13.3) put these carbon stores at risk. Additionally, the rate of carbon uptake on a given acre of forest can vary with weather, making it potentially sensitive to climate changes.56

Opportunities to increase the net uptake of carbon from the atmosphere by the land include49 increasing the amount of area in ecosystems with high carbon content (by converting farms to forests or grasslands); increasing the rate of carbon uptake in existing ecosystems (through fertilization); and reducing carbon loss from existing ecosystems (for example, through no-till farming).50 Because of these effects, policies specifically aimed at increasing carbon storage, either directly through mandates or indirectly through a market for carbon offsets, may be used to encourage more land-based carbon storage.52,53

The following uncertainties deserve further investigation: 1) the effects of these policies or actions on the balance of other greenhouse gases, like methane and nitrous oxide; 2) the degree of permanence these carbon stores will have in a changing climate (especially through the effects of disturbances like fires and plant pests51); 3) the degree to which increases in carbon storage can be attributed to any specific policy, or whether or not they may have occurred without any policy change; and 4) the possibility that increased carbon storage in one location might be partially offset by releases in another. All of these specific mitigation options present implementation challenges, as the decisions must be weighed against competing objectives. For example, retiring farmland to sequester carbon may be difficult to achieve if crop prices rise,57 such as has occurred in recent years in response to the fast-growing market for biofuels. Agricultural research and development that increases the productivity of the sector presents the possibility of reducing demand for agricultural land and may serve as a powerful greenhouse gas mitigation strategy, although the ultimate net effect on greenhouse gas emissions is uncertain.58

Land-use decisions in urban areas also present carbon reduction options. Carbon storage in urban areas can reach densities as high as those found in tropical forests, with most of that carbon found in soils, but also in vegetation, landfills, and the structures and contents of buildings.59 Urban and suburban areas tend to be net sources of carbon to the atmosphere, whereas exurban and rural areas tend to be net sinks.60 Effects of urban development patterns on carbon storage and emissions due to land and fossil fuel use are topics of current research and can be affected by land-use planning choices. Many cities have adopted land-use plans with explicit carbon goals, typically targeted at reducing carbon emissions from the often intertwined activities of transportation and energy use. This trend, which includes major cities such as Los Angeles,61 Chicago,62 and New York City63 as well as small towns, such as Homer, Alaska,64 has occurred even in the absence of a formal federal climate policy.

References

  1. Arnfield, A. J., 2003: Two decades of urban climate research: A review of turbulence, exchanges of energy and water, and the urban heat island. International Journal of Climatology, 23, 1-26, doi:10.1002/joc.859. | Detail

  2. Barnston, A. G., and P. T. Schickedanz, 1984: The effect of irrigation on warm season precipitation in the southern Great Plains. Journal of Climate and Applied Meteorology, 23, 865-888, doi:10.1175/1520-0450(1984)0232.0.CO;2. | Detail

  3. Berke, P. R., D. R. Godschalk, E. J. Kaiser, and D. A. Rodriguez, 2006: Urban Land Use Planning. University of Illinois Press. | Detail

  4. Bierwagen, B. G., D. M. Theobald, C. R. Pyke, A. Choate, P. Groth, J. V. Thomas, and P. Morefield, 2010: National housing and impervious surface scenarios for integrated climate impact assessments. Proceedings of the National Academy of Sciences, 107, 20887-20892, doi:10.1073/pnas.1002096107. | Detail

  5. Bonan, G. B., 2001: Observational evidence for reduction of daily maximum temperature by croplands in the Midwest United States. Journal of Climate, 14, 2430-2442, doi:10.1175/1520-0442(2001)0142.0.CO;2. | Detail

  6. Bonfils, C., and D. Lobell, 2007: Empirical evidence for a recent slowdown in irrigation-induced cooling. Proceedings of the National Academy of Sciences, 104, 13582-13587, doi:10.1073/pnas.0700144104. | Detail

  7. Brown, D. G., K. M. Johnson, T. R. Loveland, and D. M. Theobald, 2005: Rural land-use trends in the conterminous United States, 1950-2000. Ecological Applications, 15, 1851-1863, doi:10.1890/03-5220. | Detail

  8. Cambardella, C. A., and J. L. Hatfield, 2013: Ch. 15: Soil carbon dynamics in agricultural systems. Land Use and the Carbon Cycle: Advances in Integrated Science, Management and Policy, D.G. Brown, Robinson, D.T., French, N.H., and Reed, B.C., Eds., Cambridge University Press, 381-401. | Detail

  9. Churkina, G., D. G. Brown, and G. Keoleian, 2010: Carbon stored in human settlements: The conterminous United States. Global Change Biology, 16, 135-143, doi:10.1111/j.1365-2486.2009.02002.x. | Detail

  10. ,, 2012: Chicago Green Homes Program: City of Chicago. URL | Detail

  11. ,, 2007: City of Homer Climate Action Plan: Reducing the Threat of Global Climate Change Through Government and Community Efforts. 44 pp., City of Homer, Homer, Alaska. URL | Detail

  12. DeAngelis, A., F. Dominguez, Y. Fan, A. Robock, M. D. Kustu, and D. Robinson, 2010: Evidence of enhanced precipitation due to irrigation over the Great Plains of the United States. Journal of Geophysical Research, 115, D15115, doi:10.1029/2010JD013892. | Detail

  13. DeFries, R. S., G. P. Asner, and R. A. Houghton, 2004: Ecosystems and Land Use Change. Vol. 153American Geophysical Union, 344 pp. | Detail

  14. ,, 2011: ClimateLA: City of Los Angeles. URL | Detail

  15. Fall, S., N. S. Diffenbaugh, D. Niyogi, R. A. Pielke, Sr, and G. Rochon, 2010: Temperature and equivalent temperature over the United States (1979–2005). International Journal of Climatology, 30, 2045-2054, doi:10.1002/joc.2094. URL | Detail

  16. Foley, J. A., R. DeFries, G. P. Asner, C. Barford, G. Bonan, S. R. Carpenter, S. F. Chapin, III, M. T. Coe, G. C. Daily, H. K. Gibbs, J. H. Helkowski, T. Holloway, E. A. Howard, C. J. Kucharik, C. Monfreda, J. A. Patz, C. I. Prentice, N. Ramankutty, and P. K. Snyder, 2005: Global Consequences of Land Use. Science, 309, 570-574, doi:10.1126/science.1111772. | Detail

  17. Fry, J. A., G. Xian, S. Jin, J. A. Dewitz, C. G. Homer, Y. Limin, C. A. Barnes, N. D. Herold, and J. D. Wickham, 2011: Completion of the 2006 national land cover database for the conterminous United States. Photogrammetric Engineering & Remote Sensing, 77, 858-864. | Detail

  18. Hammer, R. B., S. I. Stewart, and V. C. Radeloff, 2009: Demographic trends, the wildland–urban interface, and wildfire management. Society & Natural Resources, 22, 777-782, doi:10.1080/08941920802714042. | Detail

  19. Harding, K. J., and P. K. Snyder, 2012: Modeling the atmospheric response to irrigation in the Great Plains. Part II: The precipitation of irrigated water and changes in precipitation recycling. Journal of Hydrometeorology, 13, 1687-1703, doi:10.1175/JHM-D-11-099.1. URL | Detail

  20. Harding, K. J., and P. K. Snyder, 2012: Modeling the atmospheric response to irrigation in the Great Plains. Part I: General impacts on precipitation and the energy budget. Journal of Hydrometeorology, 13, 1667-1686, doi:10.1175/jhm-d-11-098.1. URL | Detail

  21. Hollman, F. W., T. J. Mulder, and J. E. Kallan, 2000: Methodology and Assumptions for Population Projections of the United States: 1999 to 2100. Population Division Working Paper No. 38. U.S. Census Bureau, Washington, D.C. URL | Detail

  22. Homer, C., J. Dewitz, J. Fry, M. Coan, N. Hossain, C. Larson, N. Herold, A. McKerrow, J. N. VanDriel, and J. Wickham, 2007: Completion of the 2001 national land cover database for the conterminous United States. Photogrammetric Engineering & Remote Sensing, 73, 337-341. URL | Detail

  23. Hurteau, M. D., 2013: Ch. 14: Effects of wildland fire management on forest carbon stores. Land Use and the Carbon Cycle: Advances in Integrated Science, Management and Policy, D.G. Brown, Robinson, D.T., French, N.H., and Reed, B.C., Eds., Cambridge University Press, 359-380. | Detail

  24. ,, 2012: Sea Level Rise Adaptation Strategy for San Diego Bay. 133 pp., ICLEI-Local Governments for Sustainability USA, San Diego, CA. URL | Detail

  25. ,, 2010: Climate Leadership Academy: Promising Practices in Adaptation & Resilience, A Resource Guide for Local Leaders, Version 1.0. 107 pp., Institute for Sustainable Communities, Vermont. URL | Detail

  26. Izzaurralde, R. C., W. M. Post, and T. O. West, 2013: Ch. 13: Managing carbon: Ecological limits and constraints. Land Use and the Carbon Cycle: Advances in Integrated Science, Management and Policy, D.G. Brown, Robinson, D.T., French, N.H., and Reed, B.C., Eds., Cambridge University Press, 331-358. | Detail

  27. Jones, C. Adaire, C. J. Nickerson, and P. W. Heisey, 2013: New uses of old tools? Greenhouse gas mitigation with agriculture sector policies. Applied Economic Perspectives and Policy, 35, 398-434, doi:10.1093/aepp/ppt020. | Detail

  28. Jones, C. Adaire, C. J. Nickerson, and N. Cavallaro, 2013: Ch. 16: U.S. Policies and greenhouse gas mitigation in agriculture. Land Use and the Carbon Cycle: Advances in Integrated Science, Management and Policy, D.G. Brown, Robinson, D.T., French, N.H., and Reed, B.C., Eds., Cambridge University Press, 403-430. | Detail

  29. Karl, T. R., B. E. Gleason, M. J. Menne, J. R. McMahon, R. R. Heim, Jr., M. J. Brewer, K. E. Kunkel, D. S. Arndt, J. L. Privette, J. J. Bates, P. Y. Groisman, and D. R. Easterling, 2012: U.S. temperature and drought: Recent anomalies and trends. Eos, Transactions, American Geophysical Union, 93, 473-474, doi:10.1029/2012EO470001. URL | Detail

  30. Landsberg, H. E., 1970: Man-made climatic changes: Man's activities have altered the climate of urbanized areas and may affect global climate in the future. Science, 170, 1265-1274, doi:10.1126/science.170.3964.1265. | Detail

  31. Lebow, B., T. Patel-Weynand, T. Loveland, and R. Cantral, 2012: Land Use and Land Cover National Stakeholder Workshop Technical Report. Report prepared for 2013 National Climate Assessment. 73 pp. URL | Detail

  32. Lobell, D. B., C. B. Field, K. N. Cahill, and C. Bonfils, 2006: Impacts of future climate change on California perennial crop yields: Model projections with climate and crop uncertainties. Agricultural and Forest Meteorology, 141, 208-218, doi:10.1016/j.agrformet.2006.10.006. | Detail

  33. Loveland, T., R. Mahmood, T. Patel-Weynand, K. Karstensen, K. Beckendorf, N. Bliss, and A. Carleton, 2012: National Climate Assessment Technical Report on the Impacts of Climate and Land Use and Land Cover Change. 87 pp., U.S. Department of the Interior, U.S. Geological Survey, Reston, VA. URL | Detail

  34. Loveland, T. R., T. L. Sohl, S. V. Stehman, A. L. Gallant, K. L. Sayler, and D. E. Napton, 2002: A strategy for estimating the rates of recent United States land cover changes. Photogrammetric Engineering & Remote Sensing, 68, 1091-1099. URL | Detail

  35. Lubowski, R. N., A. J. Plantinga, and R. N. Stavins, 2008: What drives land-use change in the United States? A national analysis of landowner decisions. Land Economics, 84, 529-550, doi:10.3368/le.84.4.529. | Detail

  36. Mahmood, R., K. G. Hubbard, R. D. Leeper, and S. A. Foster, 2008: Increase in near-surface atmospheric moisture content due to land use changes: Evidence from the observed dew point temperature data. Monthly Weather Review, 136, 1554-1561, doi:10.1175/2007MWR2040.1. URL | Detail

  37. McPherson, R. A., D. J. Stensrud, and K. C. Crawford, 2004: The impact of Oklahoma’s winter wheat belt on the mesoscale environment. Monthly Weather Review, 132, 405-421, doi:10.1175/1520-0493(2004)132. URL | Detail

  38. Nickerson, C., R. Ebel, A. Borchers, and F. Carriazo, 2011: Major Uses of Land in the United States, 2007. U.S. Department of Agriculture, Economic Research Service. URL | Detail

  39. Niyogi, D., P. Pyle, M. Lei, S. P. Arya, C. M. Kishtawal, M. Shepherd, F. Chen, and B. Wolfe, 2011: Urban modification of thunderstorms: An observational storm climatology and model case study for the Indianapolis urban region. Journal of Applied Meteorology and Climatology, 50, 1129-1144, doi:10.1175/2010JAMC1836.1. URL | Detail

  40. ,, 2011: NYC Green Infrastructure Plan. 154 pp., New York City Department of Environmental Protection, New York, New York. URL | Detail

  41. Pearson, T., and S. Brown, 2013: Ch. 17: Opportunities and challenges for offsetting greenhouse gas emissions with forests. Land Use and the Carbon Cycle: Advances in Integrated Science, Management and Policy, D.G. Brown, Robinson, D.T., French, N.H., and Reed, B.C., Eds., Cambridge University Press, 431-454. | Detail

  42. Pielke, Sr., R. A., 2005: Land use and climate change. Science, 310, 1625-1626, doi:10.1126/science.1120529. | Detail

  43. Radeloff, V. C., R. B. Hammer, S. I. Stewart, J. S. Fried, S. S. Holcomb, and J. F. McKeefry, 2005: The wildland-urban interface in the United States. Ecological Applications, 15, 799-805, doi:10.1890/04-1413. | Detail

  44. Richter, D., and R. A. Houghton, 2011: Gross CO2 fluxes from land-use change: Implications for reducing global emissions and increasing sinks. Carbon Management, 2, 41-47, doi:10.4155/cmt.10.43. | Detail

  45. Sandstrom, M. A., R. G. Lauritsen, and D. Changnon, 2004: A central-US summer extreme dew-point climatology (1949-2000). Physical Geography, 25, 191-207, doi:10.2747/0272-3646.25.3.191. | Detail

  46. Schwalm, C. R., C. A. Williams, K. Schaefer, D. Baldocchi, T. A. Black, A. H. Goldstein, B. E. Law, W. C. Oechel, K. T. Paw, and R. L. Scott, 2012: Reduction in carbon uptake during turn of the century drought in western North America. Nature Geoscience, 5, 551-556, doi:10.1038/ngeo1529. URL | Detail

  47. ,, 2011: Living with a Rising Bay: Vulnerability and Adaptation in San Francisco Bay and on its Shoreline. 187 pp., San Francisco Bay Conservation and Development Commission, San Francisco, CA. URL | Detail

  48. Shepherd, J. M., H. Pierce, and A. J. Negri, 2002: Rainfall modification by major urban areas: Observations from spaceborne rain radar on the TRMM satellite. Journal of Applied Meteorology, 41, 689-701, doi:10.1175/1520-0450(2002)0412.0.CO;2. URL | Detail

  49. Sleeter, B. M., 2008: Late 20th century land change in the Central California Valley Ecoregion. The California Geographer, 48, 27-59. URL | Detail

  50. Sleeter, B. M., T. L. Sohl, T. R. Loveland, R. F. Auch, W. Acevedo, M. A. Drummond, K. L. Sayler, and S. V. Stehman, 2013: Land-cover change in the conterminous United States from 1973 to 2000. Global Environmental Change, 23, 733-748, doi:10.1016/j.gloenvcha.2013.03.006. URL | Detail

  51. Sleeter, B. M., T. L. Sohl, M. A. Bouchard, R. R. Reker, C. E. Soulard, W. Acevedo, G. E. Griffith, R. R. Sleeter, R. F. Auch, K. L. Sayler, S. Prisley, and Z. Zhu, 2012: Scenarios of land use and land cover change in the conterminous United States: Utilizing the special report on emission scenarios at ecoregional scales. Global Environmental Change, 22, 896-914, doi:10.1016/j.gloenvcha.2012.03.008. URL | Detail

  52. Sohl, T. L., B. M. Sleeter, K. L. Sayler, M. A. Bouchard, R. R. Reker, S. L. Bennett, R. R. Sleeter, R. L. Kanengieter, and Z. Zhu, 2012: Spatially explicit land-use and land-cover scenarios for the Great Plains of the United States. Agriculture, Ecosystems & Environment, 153, 1-15, doi:10.1016/j.agee.2012.02.019. | Detail

  53. Solecki, W., and C. Rosenzweig, 2012: U.S. Cities and Climate Change: Urban, Infrastructure, and Vulnerability Issues, Technical Input Report Series, U.S. National Climate Assessment.. URL | Detail

  54. Sorooshian, S., J. Li, K. Hsu, and X. Gao, 2011: How significant is the impact of irrigation on the local hydroclimate in California’s Central Valley? Comparison of model results with ground and remote-sensing data. Journal of Geophysical Research, 116, D06102, doi:10.1029/2010JD014775. | Detail

  55. Souch, C., and S. Grimmond, 2006: Applied climatology: Urban climate. Progress in Physical Geography, 30, 270-279, doi:10.1191/0309133306pp484pr. | Detail

  56. Stephens, S. L., M. A. Adams, J. Handmer, F. R. Kearns, B. Leicester, J. Leonard, and M. A. Moritz, 2009: Urban–wildland fires: How California and other regions of the US can learn from Australia. Environmental Research Letters, 4, 014010, doi:10.1088/1748-9326/4/1/014010. | Detail

  57. Theobald, D. M., and W. H. Romme, 2007: Expansion of the US wildland-urban interface. Landscape and Urban Planning, 83, 340-354, doi:10.1016/j.landurbplan.2007.06.002. | Detail

  58. ,, 1995: Table 1. Urban and Rural Population: 1900 to 1990. URL | Detail

  59. ,, 2012: 2010 Census Urban and Rural Classification and Urban Area Criteria. URL | Detail

  60. Wear, D. N., 2011: Forecasts of County-Level Land Uses under Three Future Scenarios: A Technical Document Supporting the Forest Service 2010 RPA Assessment. General Technical Report SRS-141. 41 pp., U.S. Department of Agriculture, Forest Service, Southern Research Station, Asheville, NC. URL | Detail

  61. Westerling, A. L., H. G. Hidalgo, D. R. Cayan, and T. W. Swetnam, 2006: Warming and earlier spring increase western U.S. forest wildfire activity. Science, 313, 940-943, doi:10.1126/science.1128834. | Detail

  62. Yow, D. M., 2007: Urban heat islands: Observations, impacts, and adaptation. Geography Compass, 1, 1227-1251, doi:10.1111/j.1749-8198.2007.00063.x. | Detail

  63. Zhao, T., M. W. Horner, and J. Sulik, 2011: A geographic approach to sectoral carbon inventory: Examining the balance between consumption-based emissions and land-use carbon sequestration in Florida. Annals of the Association of American Geographers, 101, 752-763, doi:10.1080/00045608.2011.567936. | Detail

  64. Zhu, Z., M. Bouchard, D. Butman, T. Hawbaker, Z. Li, J. Liu, S. Liu, C. McDonald, R. Reker, K. Sayler, B. Sleeter, T. Sohl, S. Stackpoole, A. Wein, and Z. Zhu, 2011: Baseline and Projected Future Carbon Storage and Greenhouse-Gas Fluxes in the Great Plains Region of the United States. Professional Paper 1787. 28 pp., U.S. Geological Survey, Reston, VA. URL | Detail

The National Climate Assessment summarizes the impacts of climate change on the United States, now and in the future.

A team of more than 300 experts guided by a 60-member Federal Advisory Committee produced the report, which was extensively reviewed by the public and experts, including federal agencies and a panel of the National Academy of Sciences.

United States Global Change Research Program logo United States Global Change Research Program participating agency logos