This website is the digital version of the 2014 National Climate Assessment, produced in collaboration with the U.S. Global Change Research Program.

For the official version, please refer to the PDF in the downloads section. The downloadable PDF is the official version of the 2014 National Climate Assessment.

Credits | Site Map

Search Options

X

Search form

Top

Welcome to the National Climate Assessment

The National Climate Assessment summarizes the impacts of climate change on the United States, now and in the future.

A team of more than 300 experts guided by a 60-member Federal Advisory Committee produced the report, which was extensively reviewed by the public and experts, including federal agencies and a panel of the National Academy of Sciences.

Explore the effects of climate change
United States Global Change Research Program logo
United States Department of Agriculture logo United States Department of Commerce logo United States Department of Defense logo United States Department of Energy logo United States Department of Health and Human Services logo United States Department of the Interior logo United States Department of State logo United States Department of Transportation logo United States Environmental Protection Agency logo National Aeronautics and Space Administration logo National Science Foundation logo Smithsonian Institution logo United States Agency for International Development logo

Observed Change

Global climate is changing and this is apparent across a wide range of observations. The global warming of the past 50 years is primarily due to human activities.

Explore observed climate change and its causes.

Next

Convening Lead Authors

John Walsh, University of Alaska Fairbanks

Donald Wuebbles, University of Illinois

Lead Authors

Katharine Hayhoe, Texas Tech University

James Kossin, NOAA, National Climatic Data Center

Kenneth Kunkel, CICS-NC, North Carolina State Univ., NOAA National Climatic Data Center

Graeme Stephens, NASA Jet Propulsion Laboratory

Peter Thorne, Nansen Environmental and Remote Sensing Center

Russell Vose, NOAA National Climatic Data Center

Michael Wehner, Lawrence Berkeley National Laboratory

Josh Willis, NASA Jet Propulsion Laboratory

Contributing Authors

David Anderson, NOAA, National Climatic Data Center

Scott Doney, Woods Hole Oceanographic Institution

Richard Feely, NOAA Pacific Marine Environmental Laboratory

Paula Hennon, CICS-NC, North Carolina State Univ., NOAA National Climatic Data Center

Viatcheslav Kharin, Canadian Centre for Climate Modelling and Analysis, Environment Canada

Thomas Knutson, NOAA Geophysical Fluid Dynamics Laboratory

Felix Landerer, NASA Jet Propulsion Laboratory

Tim Lenton, Exeter University

John Kennedy, UK Meteorological Office

Richard Somerville, Scripps Institution of Oceanography, Univ. of California, San Diego

Introduction

This chapter summarizes how climate is changing, why it is changing, and what is projected for the future. While the focus is on changes in the United States, the need to provide context sometimes requires a broader geographical perspective. Additional geographic detail is presented in the regional chapters of this report. Further details on the topics covered by this chapter are provided in the Climate Science Supplement and Frequently Asked Questions Appendices.

The chapter presents 12 key messages about our changing climate, together with supporting evidence for those messages. The discussion of each key message begins with a summary of recent variations or trends, followed by projections of the corresponding changes for the future.

Key Message 1: Observed Climate Change

Global climate is changing and this change is apparent across a wide range of observations. The global warming of the past 50 years is primarily due to human activities.

Supporting Evidence
close

Supporting Evidence

Process for Developing Key Messages

Development of the key messages involved discussions of the lead authors and accompanying analyses conducted via one in-person meeting plus multiple teleconferences and email exchanges from February thru September 2012. The authors reviewed 80 technical inputs provided by the public, as well as other published literature, and applied their professional judgment.

Key message development also involved the findings from four special workshops that related to the latest scientific understanding of climate extremes. Each workshop had a different theme related to climate extremes, had approximately 30 attendees (the CMIP5 meeting had more than 100), and the workshops resulted in a paper.14 The first workshop was held in July 2011, titled Monitoring Changes in Extreme Storm Statistics: State of Knowledge.15 The second was held in November 2011, titled Forum on Trends and Causes of Observed Changes in Heatwaves, Coldwaves, Floods, and Drought.16 The third was held in January 2012, titled Forum on Trends in Extreme Winds, Waves, and Extratropical Storms along the Coasts.17 The fourth, the CMIP5 results workshop, was held in March 2012 in Hawai‘i, and resulted in an analysis of CMIP5 results relative to climate extremes in the United States.14

The Chapter Author Team’s discussions were supported by targeted consultation with additional experts. Professional expertise and judgment led to determining “key vulnerabilities.” A consensus-based approach was used for final key message selection.

Description of evidence base

The key message and supporting text summarizes extensive evidence documented in the climate science literature. Technical Input reports (82) on a wide range of topics were also reviewed; they were received as part of the Federal Register Notice solicitation for public input.

Evidence for changes in global climate arises from multiple analyses of data from in-situ, satellite, and other records undertaken by many groups over several decades.1 Changes in the mean state have been accompanied by changes in the frequency and nature of extreme events.2 A substantial body of analysis comparing the observed changes to a broad range of climate simulations consistently points to the necessity of invoking human-caused changes to adequately explain the observed climate system behavior.3,4 The influence of human impacts on the climate system has also been observed in a number of individual climate variables.5,6,7,8,9,10,11 A discussion of the slowdown in temperature increase with associated references (for example, Balmaseda et al. 2013; Easterling and Wehner 200912,13) is included in the chapter.

The Climate Science Supplement Appendix provides further discussion of types of emissions or heat-trapping gases and particles, and future projections of human-related emissions. Supplemental Message 4 of the Appendix provides further details on attribution of observed climate changes to human influence.

New information and remaining uncertainties

Key remaining uncertainties relate to the precise magnitude and nature of changes at global, and particularly regional, scales, and especially for extreme events and our ability to simulate and attribute such changes using climate models. Innovative new approaches to climate data analysis, continued improvements in climate modeling, and instigation and maintenance of reference quality observation networks such as the U.S. Climate Reference Network (http://www.ncdc.noaa.gov/crn/) all have the potential to reduce uncertainties.

Assessment of confidence based on evidence

There is very high confidence that global climate is changing and this change is apparent across a wide range of observations, given the evidence base and remaining uncertainties. All observational evidence is consistent with a warming climate since the late 1800s.

There is very high confidence that the global climate change of the past 50 years is primarily due to human activities, given the evidence base and remaining uncertainties. Recent changes have been consistently attributed in large part to human factors across a very broad range of climate system characteristics.

Confidence Level

Very High

Strong evidence (established theory, multiple sources, consistent results, well documented and accepted methods, etc.), high consensus

High

Moderate evidence (several sources, some consistency, methods vary and/or documentation limited, etc.), medium consensus

Medium

Suggestive evidence (a few sources, limited consistency, models incomplete, methods emerging, etc.), competing schools of thought

Low

Inconclusive evidence (limited sources, extrapolations, inconsistent findings, poor documentation and/or methods not tested, etc.), disagreement or lack of opinions among experts

Observed Change

Climate is defined as long-term averages and variations in weather measured over a period of several decades. The Earth’s climate system includes the land surface, atmosphere, oceans, and ice. Many aspects of the global climate are changing rapidly, and the primary drivers of that change are human in origin. Evidence for changes in the climate system abounds, from the top of the atmosphere to the depths of the oceans (Figure 2.1).1 Scientists and engineers from around the world have compiled this evidence using satellites, weather balloons, thermometers at surface stations, and many other types of observing systems that monitor the Earth’s weather and climate. The sum total of this evidence tells an unambiguous story: the planet is warming.

Figure 2.1: Ten Indicators of a Warming World Ten Indicators of a Warming World Details/Download

Temperatures at the surface, in the troposphere (the active weather layer extending up to about 5 to 10 miles above the ground), and in the oceans have all increased over recent decades (Figure 2.2). Consistent with our scientific understanding, the largest increases in temperature are occurring closer to the poles, especially in the Arctic. Snow and ice cover have decreased in most areas. Atmospheric water vapor is increasing in the lower atmosphere, because a warmer atmosphere can hold more water. Sea levels are also increasing (see Key Message 10). Changes in other climate-relevant indicators such as growing season length have been observed in many areas. Worldwide, the observed changes in average conditions have been accompanied by increasing trends in extremes of heat and heavy precipitation events, and decreases in extreme cold.2

Figure 2.2: Global Temperature and Carbon Dioxide

Global Temperature and Carbon Dioxide

CO2 Concentration

Figure 2.2: Global annual average temperature (as measured over both land and oceans) has increased by more than 1.5°F (0.8°C) since 1880 (through 2012). Red bars show temperatures above the long-term average, and blue bars indicate temperatures below the long-term average. The black line shows atmospheric carbon dioxide (CO2) concentration in parts per million (ppm). While there is a clear long-term global warming trend, some years do not show a temperature increase relative to the previous year, and some years show greater changes than others. These year-to-year fluctuations in temperature are due to natural processes, such as the effects of El Niños, La Niñas, and volcanic eruptions. (Figure source: updated from Karl et al. 200918).

Details/Download

Natural drivers of climate cannot explain the recent observed warming. Over the last five decades, natural factors (solar forcing and volcanoes) alone would actually have led to a slight cooling (see Figure 2.3).3

The majority of the warming at the global scale over the past 50 years can only be explained by the effects of human influences,3,5,4 especially the emissions from burning fossil fuels (coal, oil, and natural gas) and from deforestation. The emissions from human influences that are affecting climate include heat-trapping gases such as carbon dioxide (CO2), methane, and nitrous oxide, and particles such as black carbon (soot), which has a warming influence, and sulfates, which have an overall cooling influence (see Appendix 3: Climate Science Supplement for further discussion).20,21 In addition to human-induced global climate change, local climate can also be affected by other human factors (such as crop irrigation) and natural variability (for example, Ashley et al. 2012; DeAngelis et al. 2010; Degu et al. 2011; Lo and Famiglietti 201322,23,24,25).

The conclusion that human influences are the primary driver of recent climate change is based on multiple lines of independent evidence. The first line of evidence is our fundamental understanding of how certain gases trap heat, how the climate system responds to increases in these gases, and how other human and natural factors influence climate. The second line of evidence is from reconstructions of past climates using evidence such as tree rings, ice cores, and corals. These show that global surface temperatures over the last several decades are clearly unusual, with the last decade (2000-2009) warmer than any time in at least the last 1300 years and perhaps much longer.26,27

Figure 2.3: Separating Human and Natural Influences on Climate

Separating Human and Natural Influences on Climate

ObservationsNatural Factors OnlyNatural and Human Factors

Figure 2.3: Observed global average changes (black line), model simulations using only changes in natural factors (solar and volcanic) in green, and model simulations with the addition of human-induced emissions (blue). Climate changes since 1950 cannot be explained by natural factors or variability, and can only be explained by human factors. (Figure source: adapted from Huber and Knutti19).

Details/Download

The third line of evidence comes from using climate models to simulate the climate of the past century, separating the human and natural factors that influence climate. When the human factors are removed, these models show that solar and volcanic activity would have tended to slightly cool the earth, and other natural variations are too small to explain the amount of warming. Only when the human influences are included do the models reproduce the warming observed over the past 50 years (see Figure 2.3).

Another line of evidence involves so-called “fingerprint” studies that are able to attribute observed climate changes to particular causes. For example, the fact that the stratosphere (the layer above the troposphere) is cooling while the Earth’s surface and lower atmosphere is warming is a fingerprint that the warming is due to increases in heat-trapping gases. In contrast, if the observed warming had been due to increases in solar output, Earth’s atmosphere would have warmed throughout its entire extent, including the stratosphere.5

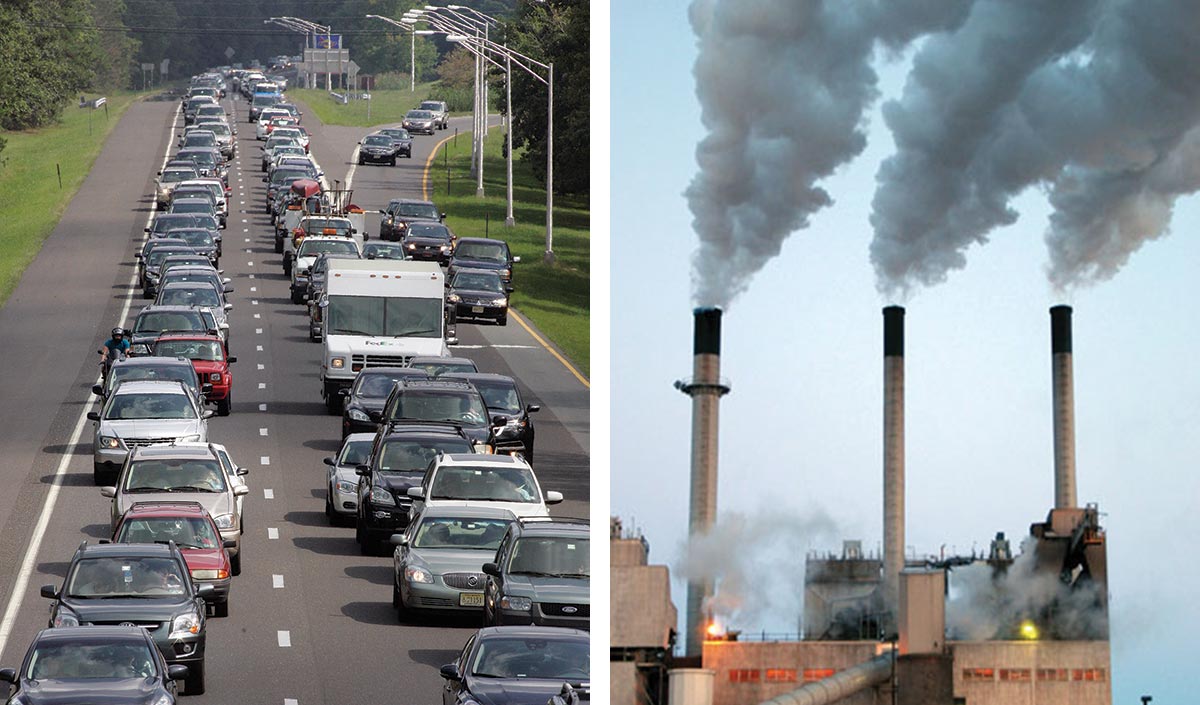
cars; power plant

Oil used for transportation and coal used for electricity genera­tion are the largest contributors to the rise in carbon dioxide that is the primary driver of observed changes in climate over recent decades.

In addition to such temperature analyses, scientific attribution of observed changes to human influence extends to many other aspects of climate, such as changing patterns in precipitation,6,7 increasing humidity,8,9 changes in pressure,10 and increasing ocean heat content.11 Further discussion of how we know the recent changes in climate are caused by human activity is provided in Appendix 3: Climate Science Supplement.

Natural variations in climate include the effects of cycles such as El Niño, La Niña and other ocean cycles; the 11-year sunspot cycle and other changes in energy from the sun; and the effects of volcanic eruptions. Globally, natural variations can be as large as human-induced climate change over timescales of up to a few decades. However, changes in climate at the global scale observed over the past 50 years are far larger than can be accounted for by natural variability. Changes in climate at the local to regional scale can be influenced by natural variability for multiple decades.28 This can affect the interpretation of climate trends observed regionally across the U.S. (see Appendix 3: Climate Science Supplement).

Globally averaged surface air temperature has slowed its rate of increase since the late 1990s. This is not in conflict with our basic understanding of global warming and its primary cause. The decade of 2000 to 2009 was still the warmest decade on record. In addition, global surface air temperature does not always increase steadily. This time period is too short to signify a change in the warming trend, as climate trends are measured over periods of decades, not years.12,29,30,31,32 Such decade-long slowdowns or even reversals in trend have occurred before in the global instrumental record (for example, 1900-1910 and 1940-1950; see Figure 2.2), including three decade-long periods since 1970, each followed by a sharp temperature rise.33 Nonetheless, satellite and ocean observations indicate that the Earth-atmosphere climate system has continued to gain heat energy.34

There are a number of possible contributions to the lower rate of increase over the last 15 years. First, the solar output during the latest 11-year solar cycle has been lower over the past 15 years than the past 60 years. Second, a series of mildly explosive volcanoes, which increased stratospheric particles, likely had more of a cooling effect than previously recognized.35,36,37 Third, the high incidence of La Niña events in the last 15 years has played a role in the observed trends.29,38 Recent analyses13 suggest that more of the increase in heat energy during this period has been transferred to the deep ocean than previously. While this might temporarily slow the rate of increase in surface air temperature, ultimately it will prolong the effects of global warming because the oceans hold heat for longer than the atmosphere does.

Climate models are not intended to match the real-world timing of natural climate variations – instead, models have their own internal timing for such variations. Most modeling studies do not yet account for the observed changes in solar and volcanic forcing mentioned in the previous paragraph. Therefore, it is not surprising that the timing of such a slowdown in the rate of increase in the models would be different than that observed, although it is important to note that such periods have been simulated by climate models, with the deep oceans absorbing the extra heat during those decades.39

Models Used in the Assessment

This report uses various projections from models of the physical processes affecting the Earth’s climate system, which are discussed further in Appendix 3: Climate Science Supplement. Three distinct sets of model simulations for past and projected changes in climate are used:

  • Coupled Model Intercomparison Project, 3rd phase (CMIP3): global model analyses done for the Fourth Intergovernmental Panel on Climate Change (IPCC) assessment. Spatial resolutions typically vary from 125 to 187 miles (at mid-latitudes); approximately 25 representations of different models (not all are used in all studies). CMIP3 findings are the foundation for most of the impact analyses included in this assessment.
  • Coupled Model Intercomparison Project, 5th phase (CMIP5): newer global model analyses done for the Fifth IPCC assessment generally based on improved formulations of the CMIP3 models. Spatial resolutions typically vary from 62 to 125 miles; about 30 representations of different models (not all are used in all studies); this new information was not available in time to serve as the foundation for the impacts analyses in this assessment, and information from CMIP5 is primarily provided for comparison purposes.
  • North American Regional Climate Change Assessment Program (NARCCAP): six regional climate model analyses (and limited time-slice analyses from two global models) for the continental U.S. run at about 30-mile horizontal resolution. The analyses were done for past (1971-2000) and projected (2041-2070) time periods. Coarser resolution results from four of the CMIP3 models were used as the boundary conditions for the NARCCAP regional climate model studies, with each of the regional models doing analyses with boundary conditions from two of the CMIP3 models.

The scenarios for future human-related emissions of the relevant gases and particles used in these models are further discussed in Appendix 5: Scenarios and Models and Appendix 3: Climate Science Supplement. The emissions in these scenarios depend on various assumptions about changes in global population, economic and technological development, and choices in transportation and energy use.

References

  1. AchutaRao, K. M., B. D. Santer, P. J. Gleckler, K. E. Taylor, D. W. Pierce, T. P. Barnett, and T. M. L. Wigley, 2006: Variability of ocean heat uptake: Reconciling observations and models. Journal of Geophysical Research, 111, 20, doi:10.1029/2005jc003136. | Detail

  2. Alexander, L. V. et al., 2006: Global observed changes in daily climate extremes of temperature and precipitation. Journal of Geophysical Research, 111, 22, doi:10.1029/2005JD006290. URL | Detail

  3. Ashley, W. S., M. L. Bentley, and A. J. Stallins, 2012: Urban-induced thunderstorm modification in the Southeast United States. Climatic Change, 113, 481-498, doi:10.1007/s10584-011-0324-1. | Detail

  4. Balmaseda, M. A., K. E. Trenberth, and E. Källén, 2013: Distinctive climate signals in reanalysis of global ocean heat content. Geophysical Research Letters, 40, 1754-1759, doi:10.1002/grl.50382. URL | Detail

  5. Bourassa, A. E., A. Robock, W. J. Randel, T. Deshler, L. A. Rieger, N. D. Lloyd, E. J. Llewellyn, and D. A. Degenstein, 2012: Large volcanic aerosol load in the stratosphere linked to Asian monsoon transport. Science, 337, 78-81, doi:10.1126/science.1219371. URL | Detail

  6. Bourassa, A. E., A. Robock, W. J. Randel, T. Deshler, L. A. Rieger, N. D. Lloyd, E. J. Llewellyn, and D. A. Degenstein, 2013: Response to Comments on "Large volcanic aerosol load in the stratosphere linked to Asian monsoon transport". Science, 339, 647, doi:10.1126/science.1227961. URL | Detail

  7. DeAngelis, A., F. Dominguez, Y. Fan, A. Robock, M. D. Kustu, and D. Robinson, 2010: Evidence of enhanced precipitation due to irrigation over the Great Plains of the United States. Journal of Geophysical Research, 115, D15115, doi:10.1029/2010JD013892. | Detail

  8. Degu, A. Mohamed, F. Hossain, D. Niyogi, R. Pielke, Sr., M. J. Shepherd, N. Voisin, and T. Chronis, 2011: The influence of large dams on surrounding climate and precipitation patterns. Geophysical Research Letters, 38, L04405, doi:10.1029/2010gl046482. URL | Detail

  9. Deser, C., R. Knutti, S. Solomon, and A. S. Phillips, 2012: Communication of the role of natural variability in future North American climate. Nature Climate Change, 2, 775-779, doi:10.1038/nclimate1562. URL | Detail

  10. Easterling, D. R., and M. F. Wehner, 2009: Is the climate warming or cooling? Geophysical Research Letters, 36, 3, doi:10.1029/2009GL037810. URL | Detail

  11. Foster, G., and S. Rahmstorf, 2011: Global temperature evolution 1979-2010. Environmental Research Letters, 6, 044022, doi:10.1088/1748-9326/6/4/044022. URL | Detail

  12. Gillett, N. P., and P. A. Stott, 2009: Attribution of anthropogenic influence on seasonal sea level pressure. Geophysical Research Letters, 36, L23709, doi:10.1029/2009GL041269. URL | Detail

  13. Gillett, N. P., V. K. Arora, G. M. Flato, J. F. Scinocca, and K. von Salzen, 2012: Improved constraints on 21st-century warming derived using 160 years of temperature observations. Geophysical Research Letters, 39, 5, doi:10.1029/2011GL050226. URL | Detail

  14. Hansen, J., M. Sato, P. Kharecha, and K. von Schuckmann, 2011: Earth's energy imbalance and implications. Atmospheric Chemistry and Physics, 11, 13421-13449, doi:10.5194/acp-11-13421-2011. URL | Detail

  15. Hansen, J., P. Kharecha, and M. Sato, 2013: Climate forcing growth rates: Doubling down on our Faustian bargain. Environmental Research Letters, 8, 011006, doi:10.1088/1748-9326/8/1/011006. URL | Detail

  16. Huber, M., and R. Knutti, 2012: Anthropogenic and natural warming inferred from changes in Earth's energy balance. Nature Geoscience, 5, 31-36, doi:10.1038/ngeo1327. URL | Detail

  17. ,, 2007: Summary for Policymakers. Climate Change 2007: The Physical Science Basis. Contribution of Working Group I to the Fourth Assessment Report of the Intergovernmental Panel on Climate Change, S. Solomon, Qin, D., Manning, M., Chen, Z., Marquis, M., Averyt, K.B., Tignor, M., and Miller, H.L., Eds., Cambridge University Press, 1-18. URL | Detail

  18. Karl, T. R., J. T. Melillo, and T. C. Peterson, 2009: Global Climate Change Impacts in the United States. T.R. Karl, Melillo, J.T., and Peterson, T.C., Eds. Cambridge University Press, 189 pp. URL | Detail

  19. Kennedy, J. J., P. W. Thorne, T. C. Peterson, R. A. Reudy, P. A. Stott, D. E. Parker, S. A. Good, H. A. Titchner, and K. M. Willett, 2010: How do we know the world has warmed? [in “State of the Climate in 2009”]. Bulletin of the American Meteorological Society, 91, S26-27, doi:10.1175/BAMS-91-7-StateoftheClimate. URL | Detail

  20. Knight, J., J. J. Kennedy, C. Folland, G. Harris, G. S. Jones, M. Palmer, D. Parker, A. Scaife, and P. Stott, 2009: Do global temperature trends over the last decade falsify climate predictions? [in "State of the Climate in 2008"]. Bulletin of the American Meteorological Society, 90, S22-S23, doi:10.1175/BAMS-90-8-StateoftheClimate. URL | Detail

  21. Kunkel, K. E. et al., 2013: Monitoring and understanding trends in extreme storms: State of knowledge. Bulletin of the American Meteorological Society, 94, doi:10.1175/BAMS-D-11-00262.1. URL | Detail

  22. Liebmann, B., R. M. Dole, C. Jones, I. Bladé, and D. Allured, 2010: Influence of choice of time period on global surface temperature trend estimates. Bulletin of the American Meteorological Society, 91, 1485-1491, doi:10.1175/2010BAMS3030.1. URL | Detail

  23. Lo, M. - H., and J. S. Famiglietti, 2013: Irrigation in California's Central Valley strengthens the southwestern U.S. water cycle. Geophysical Research Letters, 40, 301-306, doi:10.1002/grl.50108. URL | Detail

  24. Mann, M. E., Z. Zhang, M. K. Hughes, R. S. Bradley, S. K. Miller, S. Rutherford, and F. Ni, 2008: Proxy-based reconstructions of hemispheric and global surface temperature variations over the past two millennia. Proceedings of the National Academy of Sciences, 105, 13252-13257, doi:10.1073/pnas.0805721105. URL | Detail

  25. Meehl, G. A., J. M. Arblaster, J. T. Fasullo, A. Hu, and K. E. Trenberth, 2011: Model-based evidence of deep-ocean heat uptake during surface-temperature hiatus periods. Nature Climate Change, 1, 360-364, doi:10.1038/nclimate1229. URL | Detail

  26. Min, S. K., X. Zhang, F. W. Zwiers, and G. C. Hegerl, 2011: Human contribution to more-intense precipitation extremes. Nature, 470, 378-381, doi:10.1038/nature09763. URL | Detail

  27. ,, 2013: Continental-scale temperature variability during the past two millennia. Nature Geoscience, 6, 339-346, doi:10.1038/ngeo1797. | Detail

  28. Pall, P., T. Aina, D. A. Stone, P. A. Stott, T. Nozawa, A. G. J. Hilberts, D. Lohmann, and M. R. Allen, 2011: Anthropogenic greenhouse gas contribution to flood risk in England and Wales in autumn 2000. Nature, 470, 382-385, doi:10.1038/nature09762. URL | Detail

  29. Peterson, T. C. et al., 2013: Monitoring and understanding changes in heat waves, cold waves, floods and droughts in the United States: State of knowledge. Bulletin of the American Meteorological Society, 94, 821-834, doi:10.1175/BAMS-D-12-00066.1. URL | Detail

  30. Rahmstorf, S., M. Perrette, and M. Vermeer, 2012: Testing the robustness of semi-empirical sea level projections. Climate Dynamics, 39, 861-875, doi:10.1007/s00382-011-1226-7. | Detail

  31. Santer, B. D. et al., 2013: Identifying human influences on atmospheric temperature. Proceedings of the National Academy of Sciences, 110, 26-33, doi:10.1073/pnas.1210514109. URL | Detail

  32. Santer, B. D., C. Mears, F. J. Wentz, K. E. Taylor, P. J. Gleckler, T. M. L. Wigley, T. P. Barnett, J. S. Boyle, W. Brüggemann, N. P. Gillett, S. A. Klein, G. A. Meehl, T. Nozawa, D. W. Pierce, P. A. Stott, W. M. Washington, and M. F. Wehner, 2007: Identification of human-induced changes in atmospheric moisture content. Proceedings of the National Academy of Sciences, 104, 15248-15253, doi:10.1073/pnas.0702872104. URL | Detail

  33. Santer, B. D., C. Mears, C. Doutriaux, P. Caldwell, P. J. Gleckler, T. M. L. Wigley, S. Solomon, N. P. Gillett, D. Ivanova, T. R. Karl, J. R. Lanzante, G. A. Meehl, P. A. Stott, K. E. Taylor, P. W. Thorne, M. F. Wehner, and F. J. Wentz, 2011: Separating signal and noise in atmospheric temperature changes: The importance of timescale. Journal of Geophysical Research, 116, 1-19, doi:10.1029/2011JD016263. URL | Detail

  34. Solomon, S., J. S. Daniel, R. R. Neely, J. - P. Vernier, E. G. Dutton, and L. W. Thomason, 2011: The persistently variable “background” stratospheric aerosol layer and global climate change. Science, 333, 866-870, doi:10.1126/science.1206027. | Detail

  35. Stott, P. A., N. P. Gillett, G. C. Hegerl, D. J. Karoly, D. A. Stone, X. Zhang, and F. Zwiers, 2010: Detection and attribution of climate change: A regional perspective. Wiley Interdisciplinary Reviews: Climate Change, 1, 192-211, doi:10.1002/wcc.34. | Detail

  36. Vose, R. S. et al., 2013: Monitoring and understanding changes in extremes: Extratropical storms, winds, and waves. Bulletin of the American Meteorological Society, in press, doi:10.1175/BAMS-D-12-00162.1. URL | Detail

  37. Wigley, T. M. L., and B. D. Santer, 2013: A probabilistic quantification of the anthropogenic component of twentieth century global warming. Climate Dynamics, 40, 1087-1102, doi:10.1007/s00382-012-1585-8. | Detail

  38. Willett, K. M., N. P. Gillett, P. D. Jones, and P. W. Thorne, 2007: Attribution of observed surface humidity changes to human influence. Nature, 449, 710-712, doi:10.1038/nature06207. | Detail

  39. Wuebbles, D. J., G. Meehl, K. Hayhoe, T. R. Karl, K. Kunkel, B. Santer, M. Wehner, B. Colle, E. M. Fischer, R. Fu, A. Goodman, E. Janssen, H. Lee, W. Li, L. N. Long, S. Olsen, A. J. Sheffield, and L. Sun, 2013: CMIP5 climate model analyses: Climate extremes in the United States. Bulletin of the American Meteorological Society, in press, doi:10.1175/BAMS-D-12-00172.1. URL | Detail

The National Climate Assessment summarizes the impacts of climate change on the United States, now and in the future.

A team of more than 300 experts guided by a 60-member Federal Advisory Committee produced the report, which was extensively reviewed by the public and experts, including federal agencies and a panel of the National Academy of Sciences.

United States Global Change Research Program logo United States Global Change Research Program participating agency logos