


Essential Services are Interdependent
Urban areas rely on links to multiple jurisdictions through a complex set of infrastructure systems.2 For example, cities depend on other areas for supplies of food, materials, water, energy, and other inputs, and surrounding areas are destinations for products, services, and wastes from cities. If infrastructure and other connections among source areas and cities are disrupted by climate change, then the dependent urban area also will be affected.3 Moreover, the economic base of an urban area depends on regional comparative advantage; therefore, if competitors, markets, and/or trade flows are affected by climate change, a particular urban area is also affected.1

Urban vulnerabilities to climate change impacts are directly related to clusters of supporting resources and infrastructures located in other regions. For example, about half of the nation’s oil refineries are located in only four states.4 Experience over the past decade with major infrastructure disruptions, such as the 2011 San Diego blackout, the 2003 Northeast blackout, and Hurricane Irene in 2011, has shown that the greatest losses from disruptive events may be distant from where damages started.1 In another example, Hurricane Katrina disrupted oil terminal operations in southern Louisiana, not because of direct damage to port facilities, but because workers could not reach work locations through surface transportation routes and could not be housed locally because of disruption to potable water supplies, housing, and food shipments.5
Although infrastructures and urban systems are often considered individually – for example, transportation or water supply or wastewater/drainage – they are usually highly interactive and interdependent.6
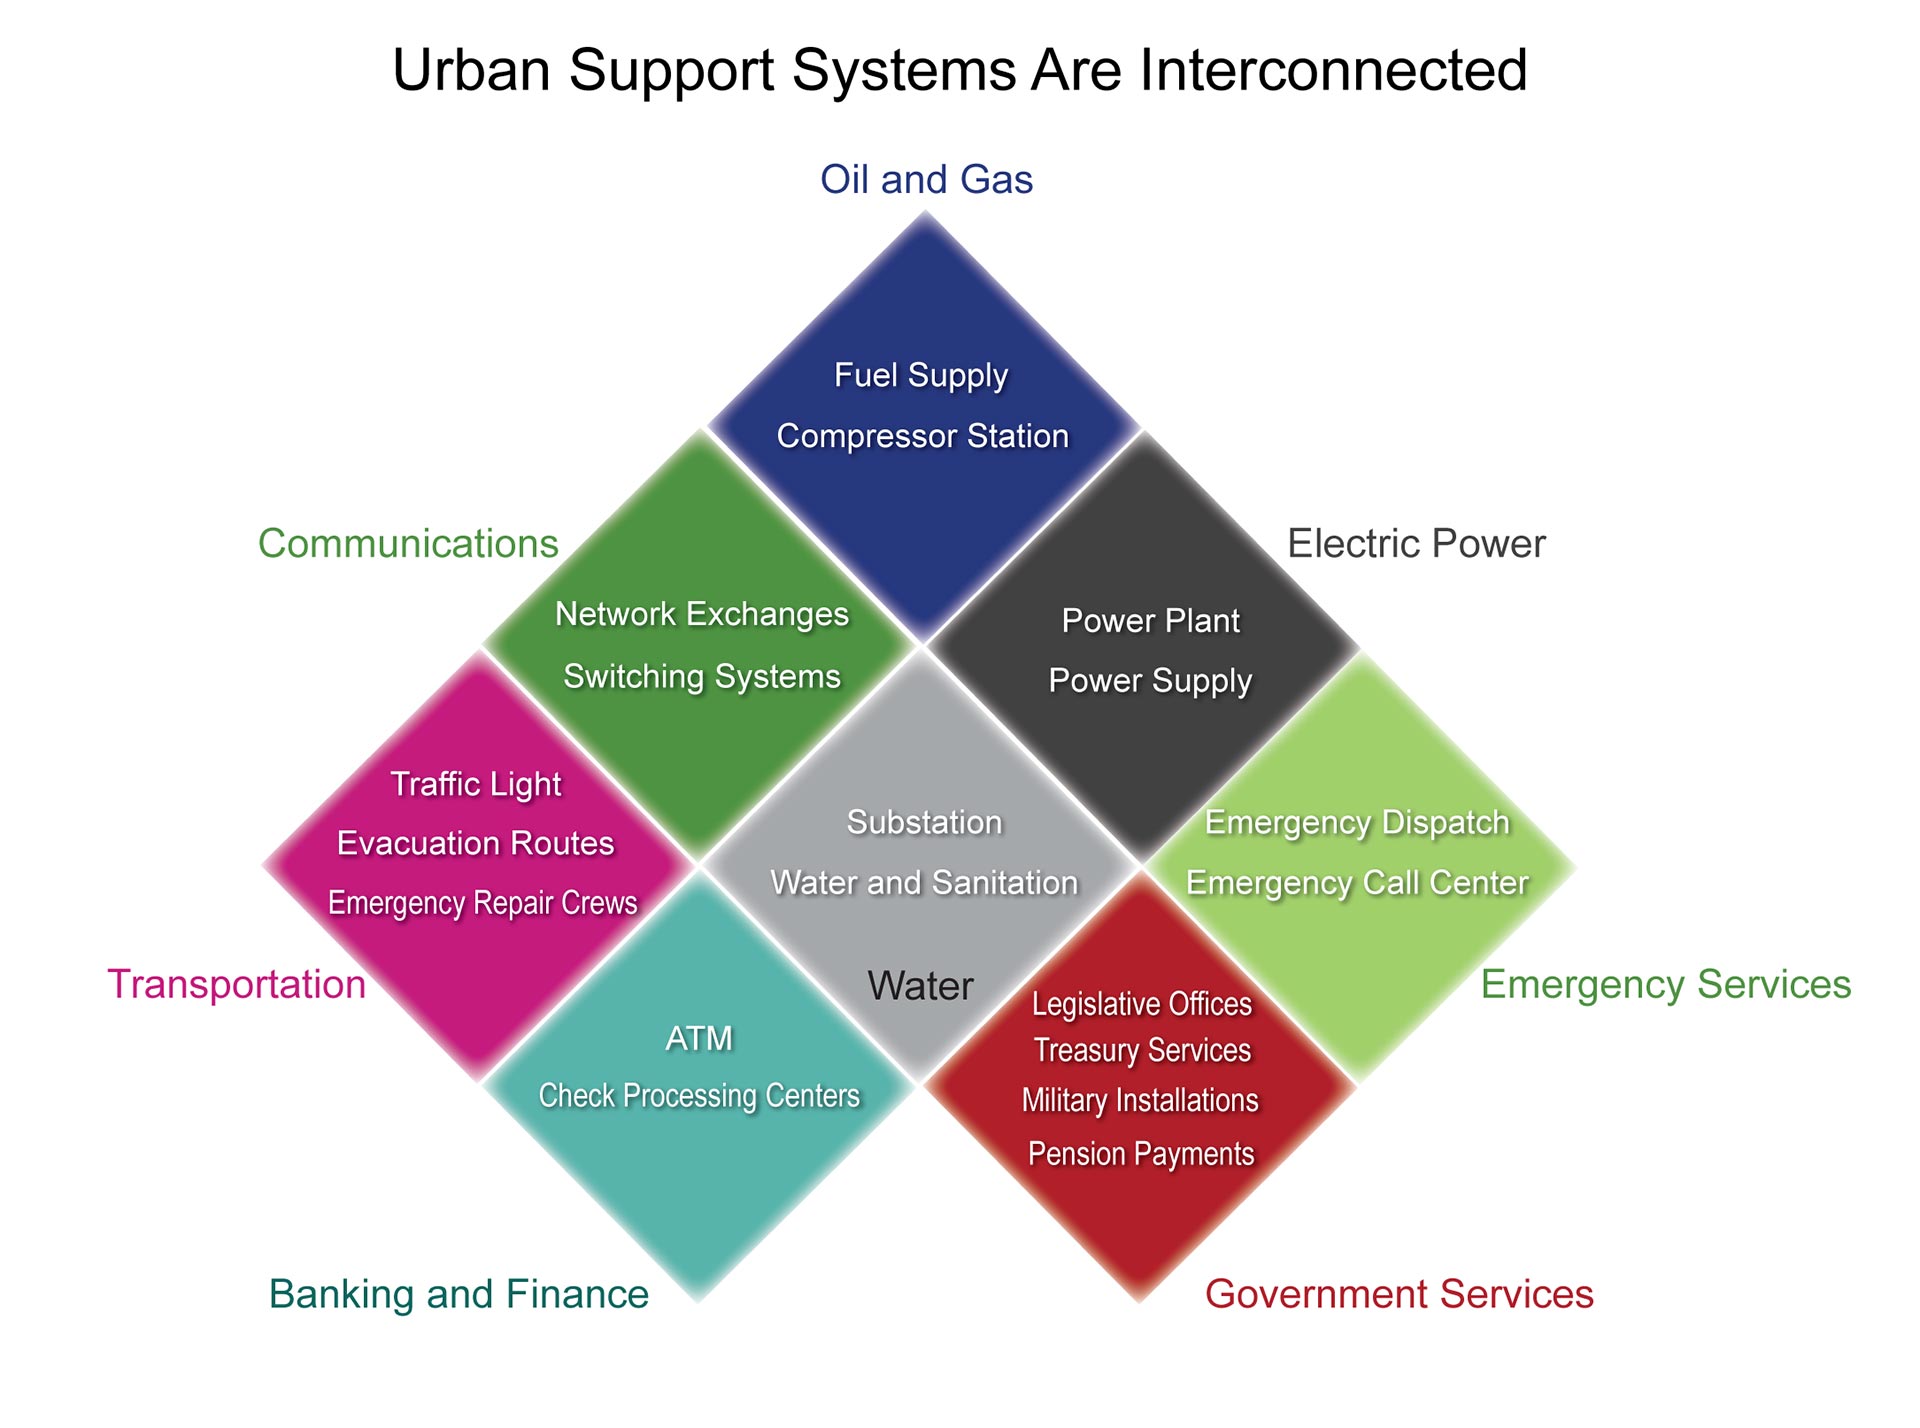
Such interdependencies can lead to cascading disruptions throughout urban infrastructures. These disruptions, in turn, can result in unexpected impacts on communication, water, and public health sectors, at least in the short term. On August 8, 2007, New York City experienced an intense rainfall and thunderstorm event during the morning commute, where between 1.4 and 3.5 inches of rain fell within two hours.7 The event started a cascade of transit system failures – eventually stranding 2.5 million riders, shutting down much of the subway system, and severely disrupting the city’s bus system.7,8 The storm’s impact was unprecedented and, coupled with two other major system disruptions that occurred in 2004 and 2007, became the impetus for a full-scale assessment and review of transit procedures and policy in response to climate change.7,8,9
In August 2003, an electric power blackout that caused 50 million people in the U.S. Northeast and Midwest and Ontario, Canada, to lose electric power further illustrates the interdependencies of major infrastructure systems. The blackout caused significant indirect damage, such as shutdowns of water treatment plants and pumping stations. Other impacts included interruptions in communication systems for air travel and control systems for oil refineries. At a more local level, the lack of air conditioning and elevator access meant many urban residents were stranded in over-heating high-rise apartments. Similar cascading impacts have been observed from extreme weather events such as Hurricanes Katrina and Irene.1 In fact, as urban infrastructures become more interconnected and more complex, the likelihood of large-scale cascading impacts will increase as risks to infrastructure increase.10
Hurricane Sandy: Urban Systems, Infrastructure, and Vulnerability
 Courtesy of NOAA
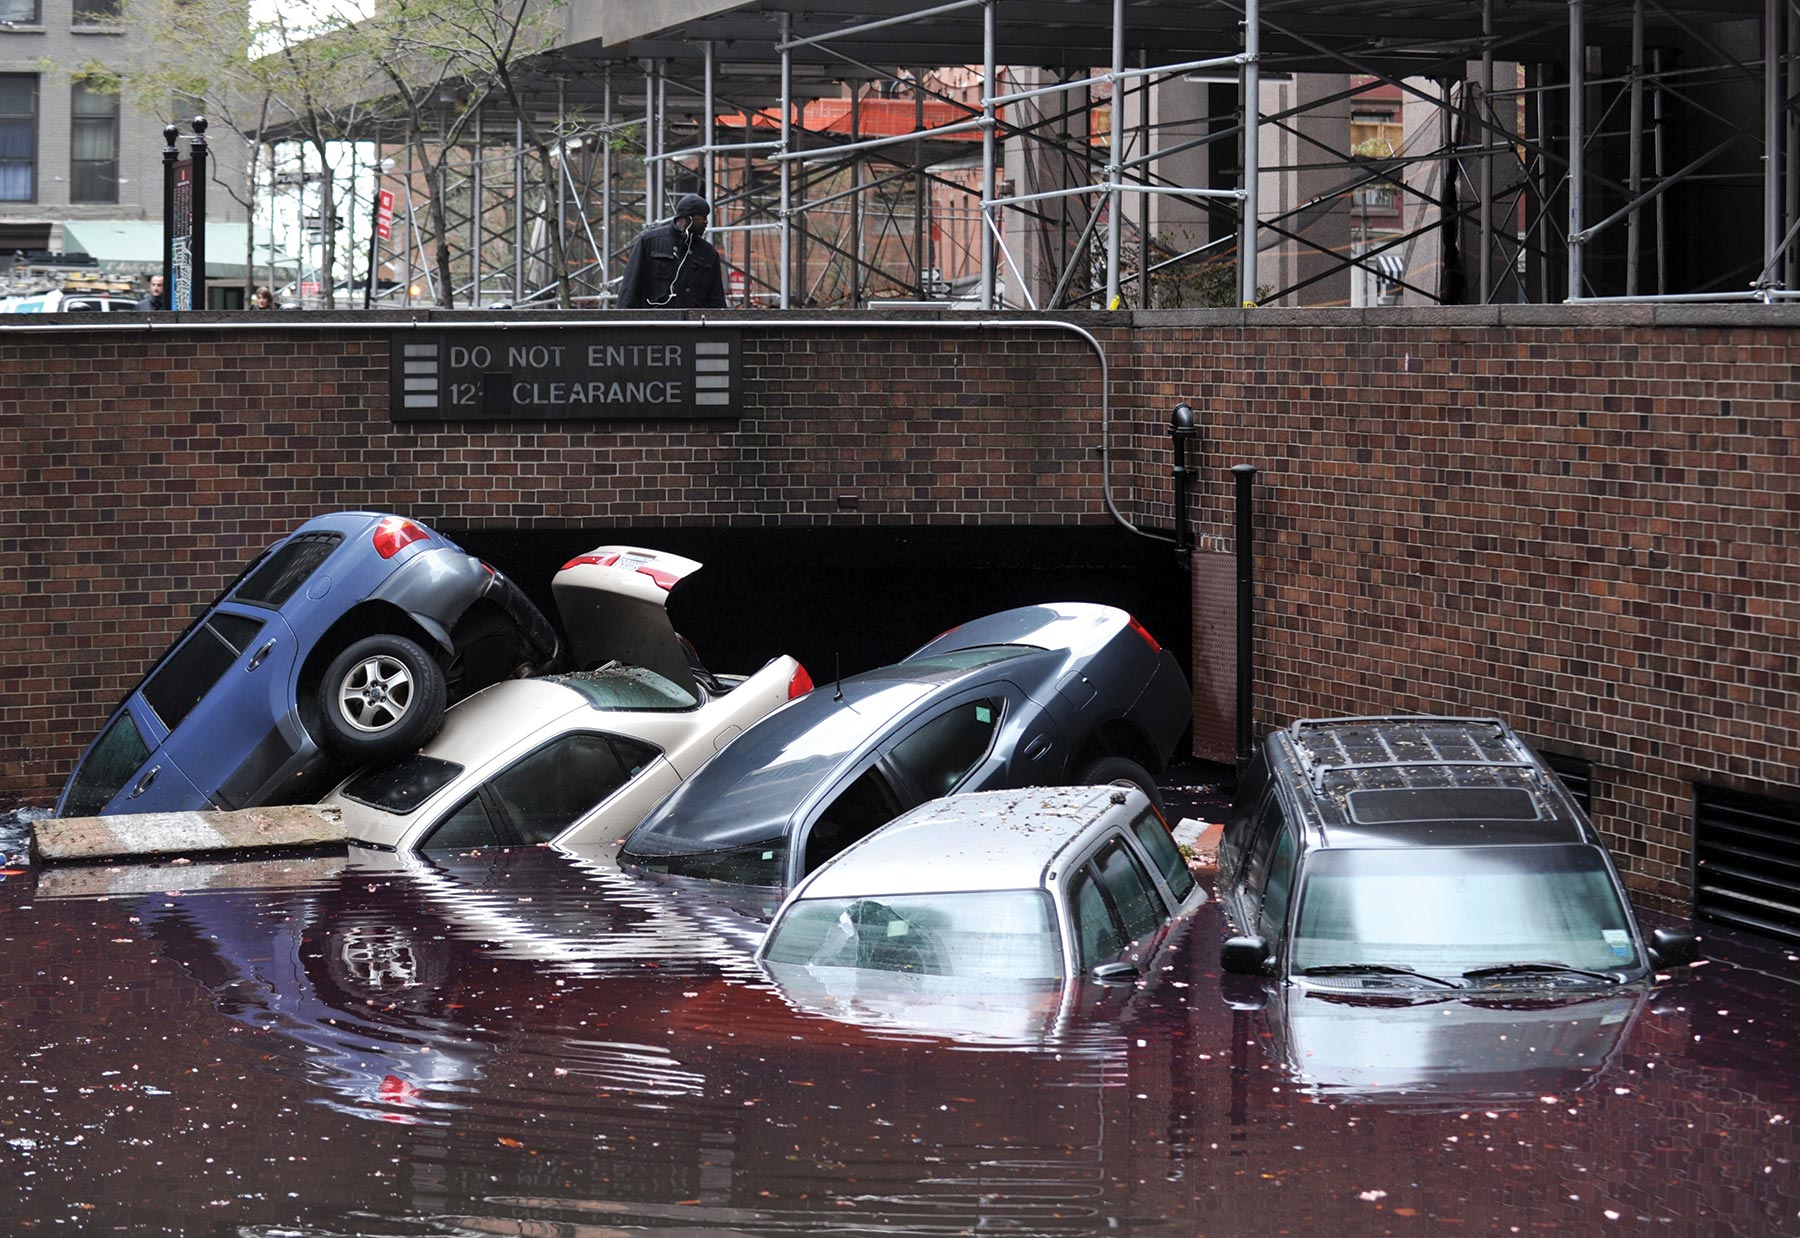
Sandy made landfall on the New Jersey shore just south of Atlantic City on October 29, 2012, and became one of the most damaging storms to strike the continental United States. Sandy affected cities throughout the Atlantic seaboard, extending across the eastern United States to Chicago, Illinois, where it generated 20-foot waves on Lake Michigan and flooded the city’s Lake Shore Drive. The storm’s strength and resulting impact has been correlated with Atlantic Ocean water temperatures near the coast that were roughly 5°F above normal, and with sea level rise along the region’s coastline as a result of a warming climate.
Sandy caused significant loss of life as well as tremendous destruction of property and critical infrastructure. It disrupted daily life for millions of coastal zone residents across the New York-New Jersey metropolitan area, despite this being one of the best disaster-prepared coastal regions in the country. The death toll from Sandy in the metropolitan region exceeded 100, and the damage was estimated to be at least $65 billion.11,12 At its peak, the storm cut electrical power to more than 8.5 million customers.12
The death and injury, physical devastation, multi-day power, heat, and water outages, gasoline shortages, and cascade of problems from Sandy’s impact reveal what happens when the complex, integrated systems upon which urban life depends are stressed and fail. One example is what occurred after a Consolidated Edison electricity distribution substation in lower Manhattan ceased operation at approximately 9 PM Monday evening, when its flood protection barrier (designed to be 1.5 feet above the 10-foot storm surge of record) was overtopped by Sandy’s 14-foot storm surge. As the substation stopped functioning, it immediately caused a system-wide loss of power for more than 200,000 customers. Residents in numerous high-rise apartment buildings were left without heat and lights, and also without elevator service and water (which must be pumped to upper floors).
Sandy also highlighted the vast differences in vulnerabilities across the extended metropolitan region. Communities and neighborhoods on the coast were most vulnerable to the physical impact of the record storm surge. Many low- to moderate-income residents live in these areas and suffered damage to or loss of their homes, leaving tens of thousands of people displaced or homeless. As a specific sub-population, the elderly and infirm were highly vulnerable, especially those living in the coastal evacuation zone and those on upper floors of apartment buildings left without elevator service. These individuals had limited adaptive capacity because they could not easily leave their residences.
Even with the extensive devastation, the effects of the storm would have been far worse if local climate resilience strategies had not been in place. For example, the City of New York and the Metropolitan Transportation Authority worked aggressively to protect life and property by stopping the operation of the city’s subway before the storm hit and moving the train cars out of low-lying, flood-prone areas. At the height of the storm surge, all seven of the city’s East River subway tunnels flooded. Catastrophic loss of life would have resulted if there had been subway trains operating in the tunnels when the storm struck. The storm also fostered vigorous debate among local and state politicians, other decision-makers, and stakeholders about how best to prepare the region for future storms. Planning is especially important given the expectation of increases in flood frequency resulting from more numerous extreme precipitation events and riverine and street level flooding, and coastal storm surge flooding associated with accelerated sea level rise and more intense (yet not necessarily more numerous) tropical storms.
