This website is the digital version of the 2014 National Climate Assessment, produced in collaboration with the U.S. Global Change Research Program.

For the official version, please refer to the PDF in the downloads section. The downloadable PDF is the official version of the 2014 National Climate Assessment.

Credits | Site Map

Search Options

X

Search form

Top

Welcome to the National Climate Assessment

The National Climate Assessment summarizes the impacts of climate change on the United States, now and in the future.

A team of more than 300 experts guided by a 60-member Federal Advisory Committee produced the report, which was extensively reviewed by the public and experts, including federal agencies and a panel of the National Academy of Sciences.

Explore the effects of climate change
United States Global Change Research Program logo
United States Department of Agriculture logo United States Department of Commerce logo United States Department of Defense logo United States Department of Energy logo United States Department of Health and Human Services logo United States Department of the Interior logo United States Department of State logo United States Department of Transportation logo United States Environmental Protection Agency logo National Aeronautics and Space Administration logo National Science Foundation logo Smithsonian Institution logo United States Agency for International Development logo

Biogeochemistry, Climate, and Interactions with Other Factors

Societal options for addressing links between climate and biogeochemical cycles must often be informed by connections to a broader context of global environmental changes. For example, both climate change and nitrogen deposition can reduce biodiversity in water- and land-based ecosystems. The greatest combined risks are expected to occur where critical loads are exceeded.4,5 A critical load is defined as the input rate of a pollutant below which no detrimental ecological effects occur over the long-term according to present knowledge.5 Although biodiversity is often shown to decline when nitrogen deposition is high due to fossil fuel combustion and agricultural emissions,5,6 the compounding effects of multiple stressors are difficult to predict. Warming and changes in water availability have been shown to interact with nitrogen in additive or synergistic ways to exacerbate biodiversity loss.7 Unfortunately, very few multi-factorial studies have been done to address this gap.

Human induced acceleration of the nitrogen and phosphorus cycles already causes widespread freshwater and marine eutrophication,8,9,10 a problem that is expected to worsen under a warming climate.9,11,12 Without efforts to reduce future climate change and to slow the acceleration of biogeochemical cycles, existing climate changes will combine with increasing inputs of nitrogen and phosphorus into freshwater and estuarine ecosystems. This combination of changes is projected to have substantial negative effects on water quality, human health, inland and coastal fisheries, and greenhouse gas emissions.13,9

Similar concerns – and opportunities for the simultaneous reduction of multiple environmental problems (known as “co-benefits”) – exist in the realms of air pollution, human health, and food security. For example, methane, volatile organic compounds, and nitrogen oxide emissions all contribute to the formation of tropospheric ozone, which is a greenhouse gas and has negative consequences for human health and crop and forest productivity.14,15,16 Rates of ozone formation are accelerated by higher temperatures, creating a reinforcing cycle between rising temperatures and continued human alteration of the nitrogen and carbon cycles.17 Rising temperatures also work against some of the benefits of air pollution control.16 Some changes will trade gains in one arena for declines in others. For example, lowered NOx, NHx, and SOx emissions remove cooling agents from the atmosphere, but improve air quality.18,19 Recent analyses suggest that targeting reductions in compounds like methane and black carbon aerosols that have both climate and air-pollution consequences can achieve significant improvements in not only the rate of climate change, but also in human health.19 Finally, reductions in excess nitrogen and phosphorus from agricultural and industrial activities can potentially reduce the rate and impacts of climate change, while simultaneously addressing concerns in biodiversity, water quality, food security, and human health.20

Estimating the U.S. Carbon Sink

Any natural or engineered process that temporarily or permanently removes and stores carbon dioxide (CO2) from the atmosphere is considered a carbon “sink.” Temporary (10 to 100 years) CO2 sinks at the global scale include absorption by plants as they photosynthesize, as well as CO2 dissolution into the ocean. Forest biomass and soils in North America offer large temporary carbon sinks in the global carbon budget; however, the spatial distribution, longevity, and mechanisms controlling these sinks are less certain.2 Understanding these processes is critical for predicting how ecosystem carbon sinks will change in the future, and potentially for managing the carbon sink as a mitigation strategy for climate change.

Both inventory (measurement) and modeling techniques have been used to estimate land-based carbon sinks at a range of scales in both time and space. For inventory methods, carbon stocks are measured at a location at two points in time, and the amount of carbon stored or lost can be estimated over the intervening time period. This method is widely used to estimate the amount of carbon stored in forests in the United States over timescales of years to decades. Terrestrial biosphere models estimate carbon sinks by modeling a suite of processes that control carbon cycling dynamics, such as photosynthesis (CO2 uptake by plants) and respiration (CO2 release by plants, animals, and microorganisms in soil and water). Field-based data and/or remotely sensed data are used as inputs and also to validate these models. Estimates of the land-based carbon sink can vary depending on the data inputs and how different processes are modeled.21 Atmospheric inverse models use information about atmospheric CO2 concentrations and atmospheric transport (like air currents) to estimate the terrestrial carbon sink.22,23 This approach can provide detailed information about carbon sinks over time. However, because atmospheric CO2 is well-mixed and monitoring sites are widely dispersed, these models estimate fluxes over large areas and it is difficult to identify processes responsible for the sink from these data.21 Recent estimates using atmospheric inverse models show that global land and ocean carbon sinks are stable or even increasing globally.24

Figure 15.5: U.S. Carbon Sinks Absorb a Fraction of CO2 Emissions U.S. Carbon Sinks Absorb a Fraction of CO<sub>2</sub> Emissions Details/Download

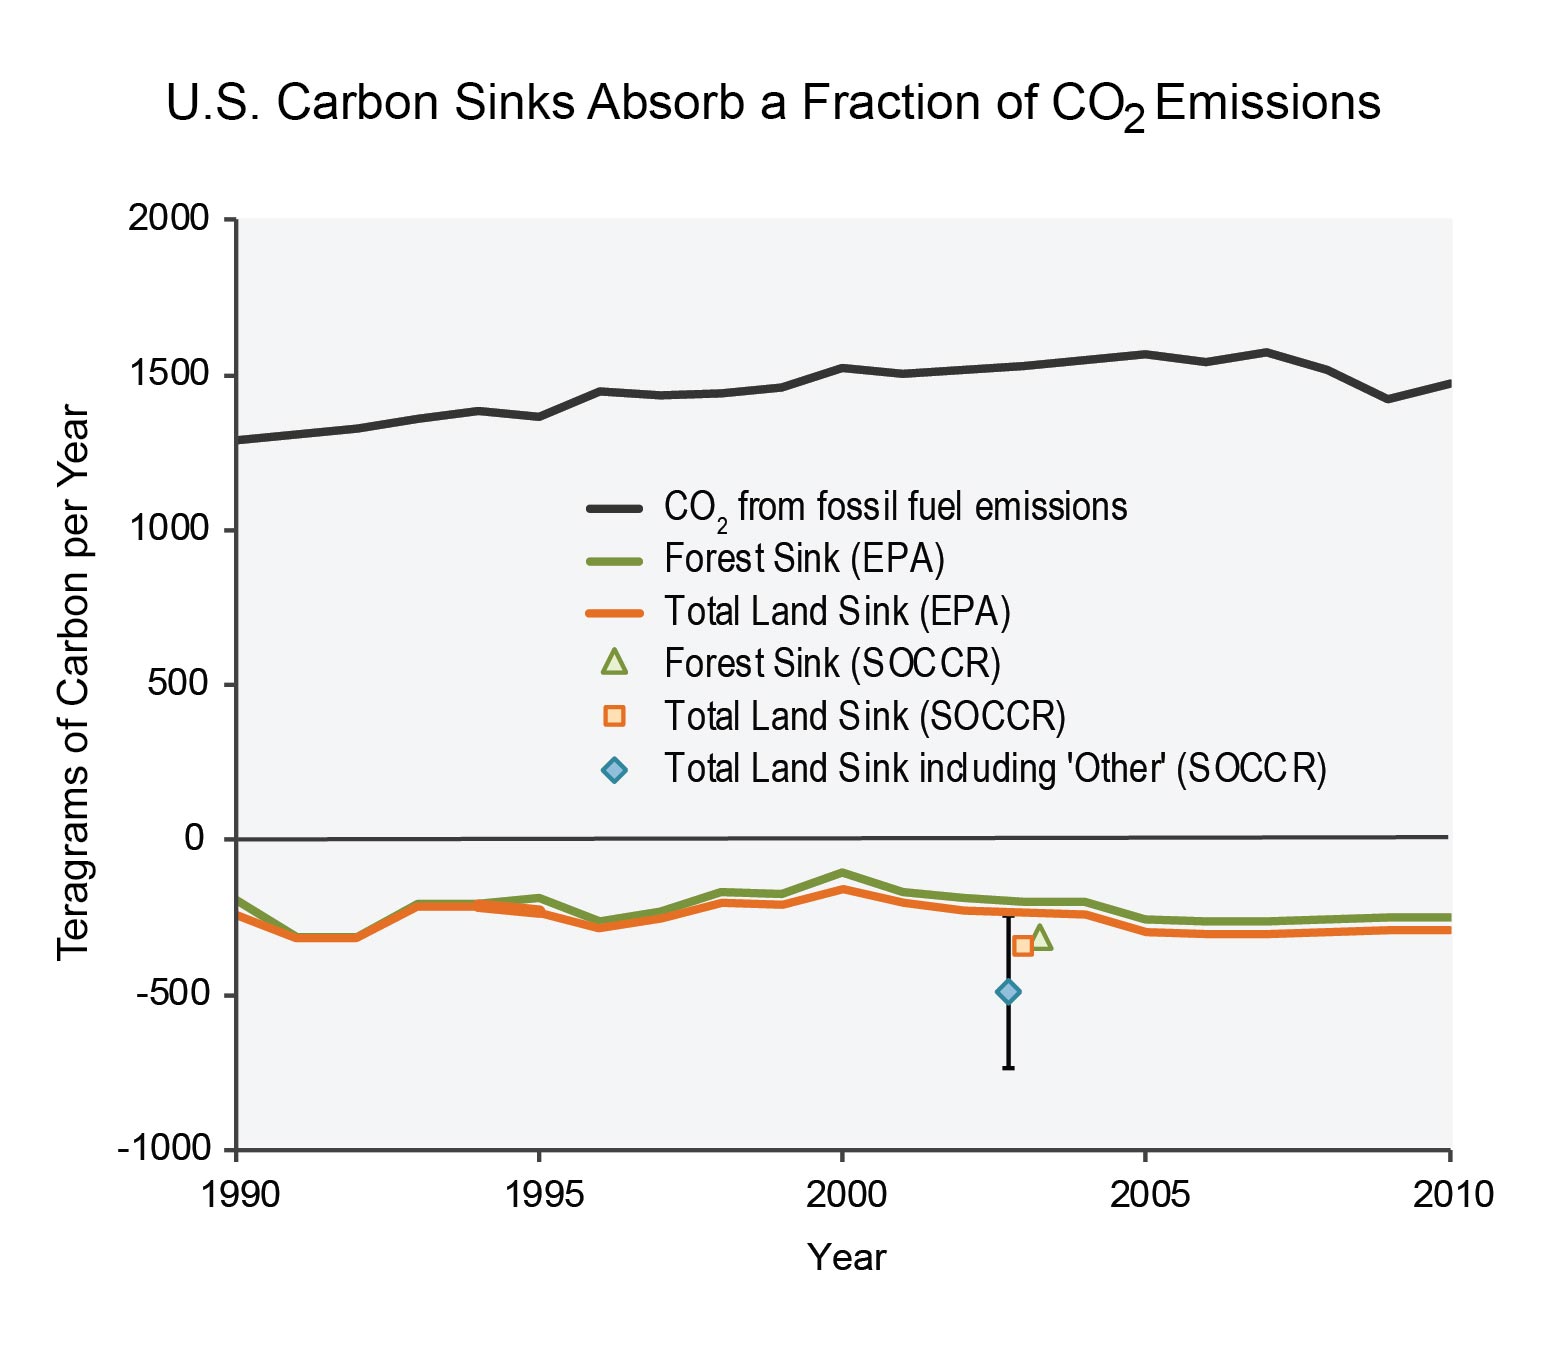
The U.S. Environmental Protection Agency (EPA) conducts an annual inventory of U.S. greenhouse gas emissions and sinks as part of the nation’s commitments under the Framework Convention on Climate Change. Estimates are based on inventory studies and models validated with field-based data (such as the CENTURY model) in accordance with the Intergovernmental Panel on Climate Change (IPCC) best practices.25 An additional comprehensive assessment, The First State of the Carbon Cycle Report (SOCCR), provides estimates for carbon sources and sinks in the U.S. and North America around 2003.2 This assessment also utilized inventory and field-based terrestrial biosphere models, and incorporated additional land sinks not explicitly included in EPA assessments.

Figure 15.6: U.S. Carbon Sources and Sinks from 1991 to 2000 and 2001 to 2010 U.S. Carbon Sources and Sinks from 1991 to 2000 and 2001 to 2010 Details/Download

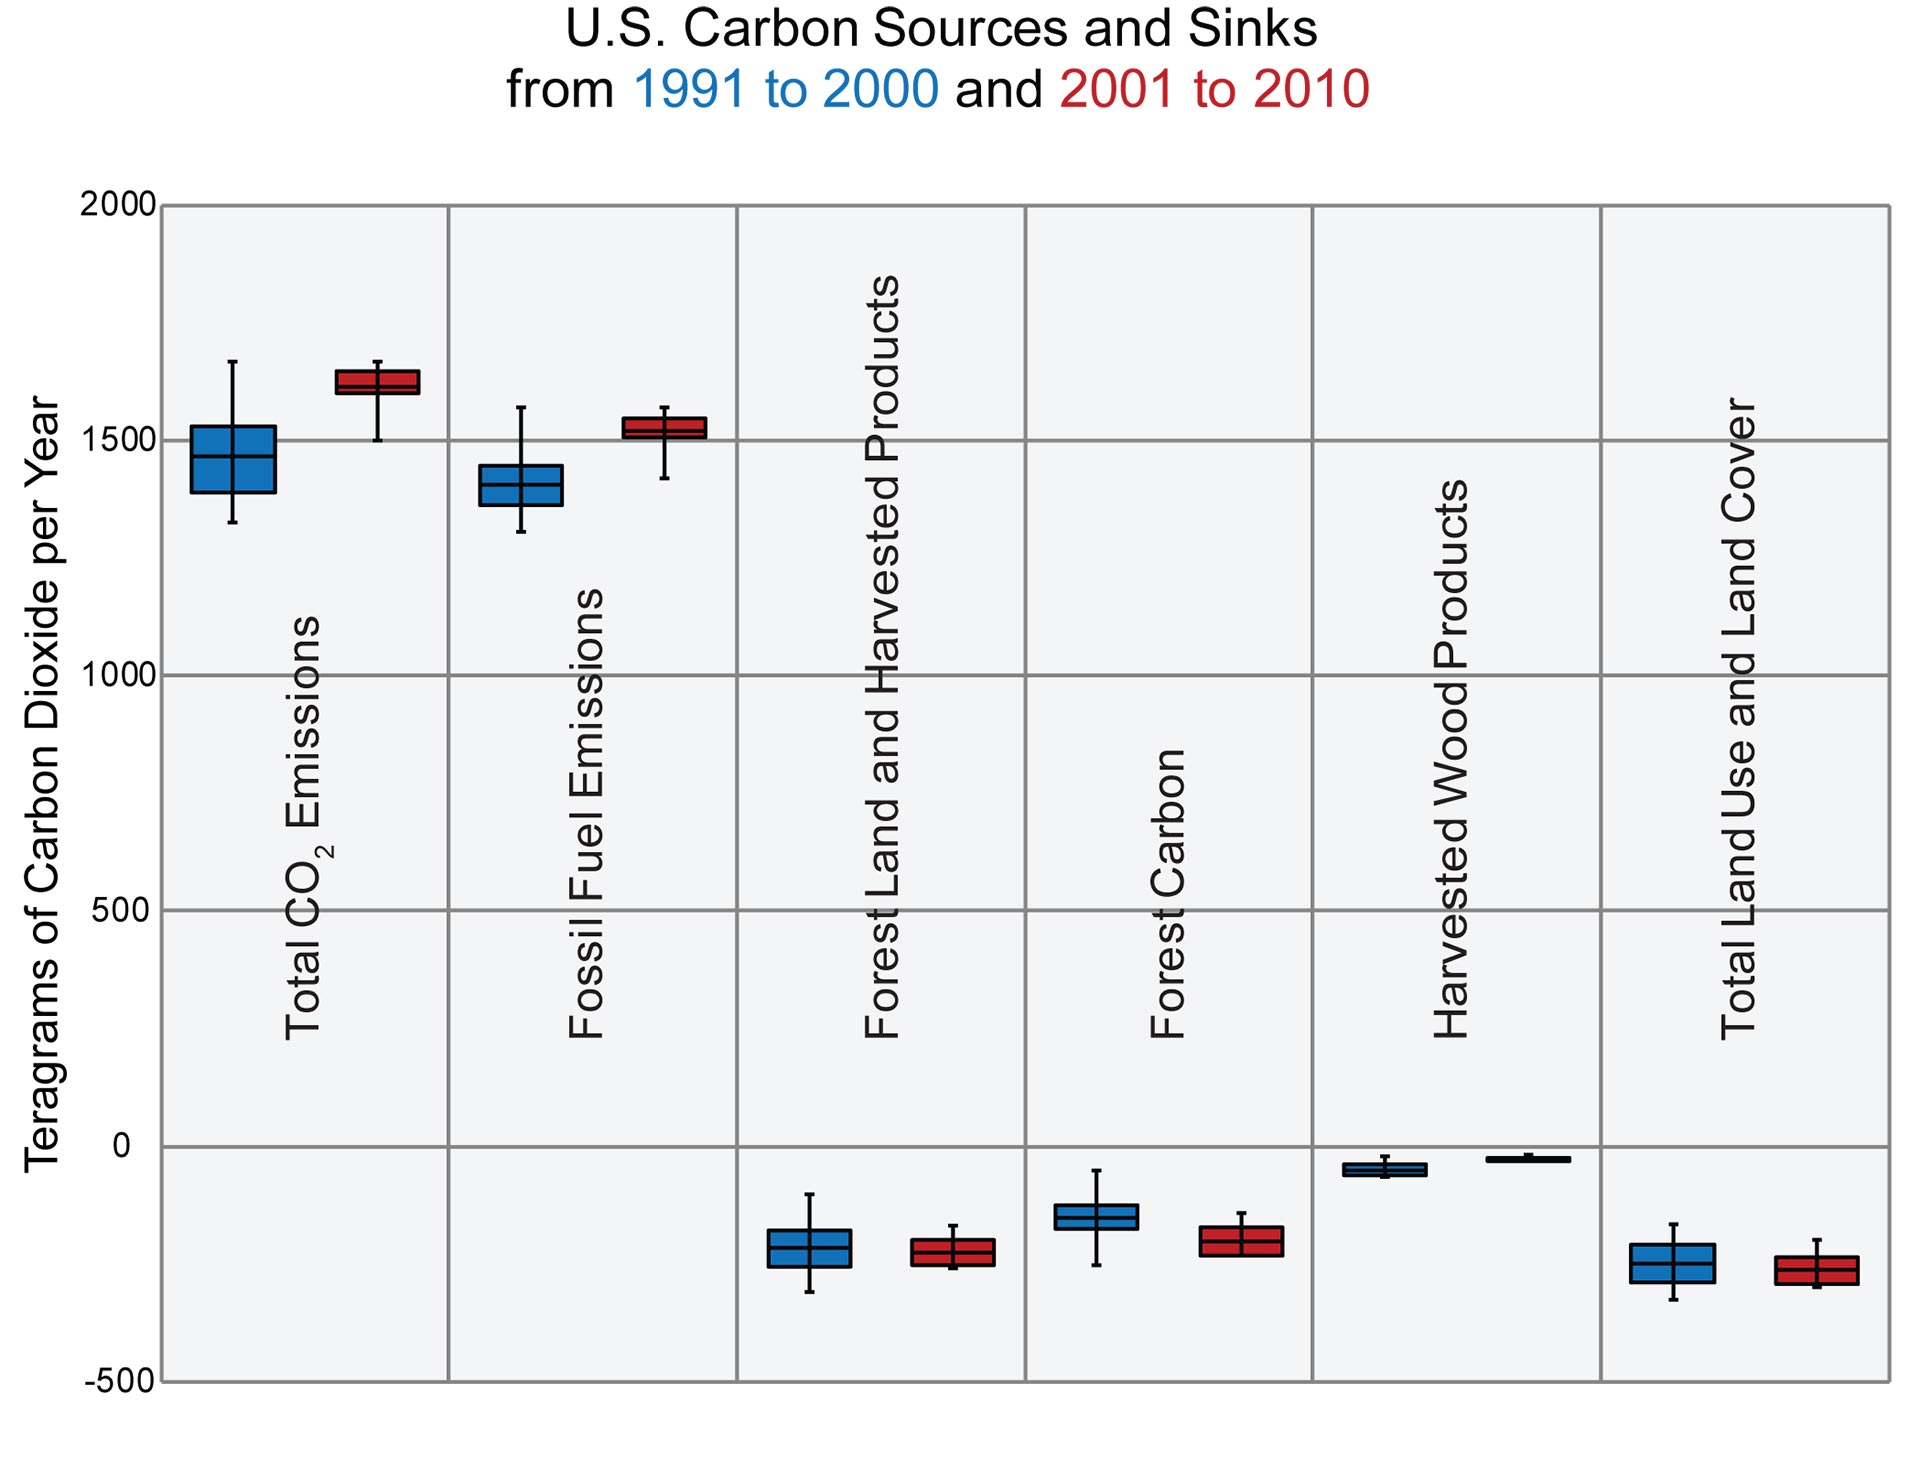
Data from these assessments suggest that the U.S. carbon sink has been variable over the last two decades, but still absorbs and stores a small fraction of CO2 emissions. The forest sink comprises the largest fraction of the total land sink in the U.S., annually absorbing 7% to 24% (with a best estimate of 16%) of fossil fuel CO2 emissions during the last two decades. Because the U.S. Forest Service has conducted detailed forest carbon inventory studies, the uncertainty surrounding the estimate for the forest sink is lower than for most other components (see Pacala et al. 2007, Table 23). The role of lakes, reservoirs, and rivers in the carbon budget, in particular, has been difficult to quantify and is rarely included in national budgets.26 The IPCC guidelines for estimating greenhouse gas sources or sinks from lakes, reservoirs, or rivers are included in the “wetlands” category, but only for lands converted to wetlands. These ecosystems are not included in the EPA’s estimates of the total land sink. Rivers and reservoirs were estimated to be a sink in the State of the Carbon Cycle analysis,3 but recent studies suggest that inland waters may actually be an important source of CO2 to the atmosphere.27 It is important to note that these two methods use different datasets, different models, and different methodologies to estimate land-based carbon sinks in the United States. In particular, we note that the EPA Inventory, consistent with IPCC Guidelines for national inventories, includes only carbon sinks designated as human-caused, while the SOCCR analysis does not make this distinction.

Table 15.1: Ecosystem Carbon Sinks

close
Land Area C sink (Tg C/y) (95% CI) Method
Forest -256 (± 50%) inventory, modeled
Wood products -57 (± 50%) inventory
Woody encroachment -120 (± >100%) inventory
Agricultural soils -8 (± 50%) modeled
Wetlands -23 (± >100%) inventory
Rivers and reservoirs -25 (± 100%) inventory
Net Land Sink -489 (± 50%) inventory

Table 15.1: Carbon (C) sinks and uncertainty estimated by Pacala et al. for the first State of the Carbon Cycle Report.3 Forests take up the highest percentage of carbon of all land-based carbon sinks. Due to a number of factors, there are high degrees of uncertainty in carbon sink estimates.

References

  1. Ballantyne, A. P., C. B. Alden, J. B. Miller, P. P. Tans, and J. W. C. White, 2012: Increase in observed net carbon dioxide uptake by land and oceans during the past 50 years. Nature, 488, 70-72, doi:10.1038/nature11299. | Detail

  2. Baron, J. S., 2006: Hindcasting nitrogen deposition to determine an ecological critical load. Ecological Applications, 16, 433-439, doi:10.1890/1051-0761(2006)016[0433:hndtda]2.0.co;2. | Detail

  3. Baron, J. S., E. K. Hall, B. T. Nolan, J. C. Finlay, E. S. Bernhardt, J. A. Harrison, F. Chan, and E. W. Boyer, 2013: The interactive effects of human-derived nitrogen loading and climate change on aquatic ecosystems of the United States. Biogeochemistry, 114, 71-92, doi:10.1007/s10533-012-9788-y. URL | Detail

  4. Bobbink, R., K. Hicks, J. Galloway, T. Spranger, R. Alkemade, M. Ashmore, M. Bustamante, S. Cinderby, E. Davidson, F. Dentener, B. Emmett, J. W. Erisman, M. Fenn, F. Gilliam, A. Nordin, L. Pardo, and W. De Vries, 2010: Global assessment of nitrogen deposition effects on terrestrial plant diversity: A synthesis. Ecological Applications, 20, 30-59, doi:10.1890/08-1140.1. | Detail

  5. Butman, D., and P. A. Raymond, 2011: Significant efflux of carbon dioxide from streams and rivers in the United States. Nature Geoscience, 4, 839-842, doi:10.1038/ngeo1294. | Detail

  6. Carpenter, S. R., 2008: Phosphorus control is critical to mitigating eutrophication. Proceedings of the National Academy of Sciences, 105, 11039-11040, doi:10.1073/pnas.0806112105. URL | Detail

  7. ,, 2007: The First State of the Carbon Cycle Report (SOCCR): The North American Carbon Budget and Implications for the Global Carbon Cycle. A Report by the U.S. Climate Change Science Program and the Subcommittee on Global Change Research. U.S. Climate Change Scie. U.S. Climate Change Science Program, 242 pp. URL | Detail

  8. Chameides, W. L., P. S. Kasibhatla, J. Yienger, and H. Levy, 1994: Growth of continental-scale metro-agro-plexes, regional ozone pollution, and world food production. Science, 264, 74-77, doi:10.1126/science.264.5155.74. | Detail

  9. Ciais, P., J. G. Canadell, S. Luyssaert, F. Chevallier, A. Shvidenko, Z. Poussi, M. Jonas, P. Peylin, A. W. King, and E. D. Schulze, 2010: Can we reconcile atmospheric estimates of the Northern terrestrial carbon sink with land-based accounting? Current Opinion in Environmental Sustainability, 2, 225-230, doi:10.1016/j.cosust.2010.06.008. | Detail

  10. Cole, J. J., Y. T. Prairie, N. F. Caraco, W. H. McDowell, L. J. Tranvik, R. G. Striegl, C. M. Duarte, P. Kortelainen, J. A. Downing, J. J. Middelburg, and J. Melack, 2007: Plumbing the global carbon cycle: Integrating inland waters into the terrestrial carbon budget. Ecosystems, 10, 172-185, doi:10.1007/s10021-006-9013-8. | Detail

  11. Davidson, E. A., 2012: Representative concentration pathways and mitigation scenarios for nitrous oxide. Environmental Research Letters, 7, 1-7, doi:10.1088/1748-9326/7/2/024005. URL | Detail

  12. ,, 2012: Inventory of U.S. Greenhouse Gas Emissions and Sinks: 1990-2010. 389 pp., U.S. Environmental Protection Agency, Washington, D.C. URL | Detail

  13. Gurney, K. R. et al., 2002: Towards robust regional estimates of CO2 sources and sinks using atmospheric transport models. Nature, 415, 626-630, doi:10.1038/415626a. | Detail

  14. Hayes, D. J., D. P. Turner, G. Stinson, A. D. McGuire, Y. Wei, T. O. West, L. S. Heath, B. de Jong, B. G. McConkey, R. A. Birdsey, A. R. Jacobson, D. N. Huntzinger, Y. Pan, M. W. Post, and R. B. Cook, 2012: Reconciling estimates of the contemporary North American carbon balance among terrestrial biosphere models, atmospheric inversions, and a new approach for estimating net ecosystem exchange from inventory-based data. Global Change Biology, 18, 1282-1299, doi:10.1111/j.1365-2486.2011.02627.x. URL | Detail

  15. Howarth, R., F. Chan, D. J. Conley, J. Garnier, S. C. Doney, R. Marino, and G. Billen, 2011: Coupled biogeochemical cycles: Eutrophication and hypoxia in temperate estuaries and coastal marine ecosystems. Frontiers in Ecology and the Environment, 9, 18-26, doi:10.1890/100008. URL | Detail

  16. ,, 2006: IPCC Guidelines for National Greenhouse Gas Inventories, Prepared by the National Greenhouse Gas Inventories Programme. Intergovernmental Panel on Climate Change, Institute for Global Environmental Strategies (IGES), Japan. URL | Detail

  17. Jacob, D. J., and D. A. Winner, 2009: Effect of climate change on air quality. Atmospheric Environment, 43, 51-63, doi:10.1016/j.atmosenv.2008.09.051. URL | Detail

  18. Jeppesen, E., M. Meerhoff, K. Holmgren, I. Gonzalez-Bergonzoni, T. - F. de Mello, S. A. J. Declerck, L. Meester, M. Søndergaard, T. L. Lauridsen, R. Bjerring, J. M. Conde-Porcuna, N. Mazzeo, C. Iglesias, M. Reizenstein, H. J. Malmquist, Z. W. Liu, D. Balayla, and X. Lazzaro, 2010: Impacts of climate warming on lake fish community structure and potential effects on ecosystem function. Hydrobiologia, 646, 73-90, doi:10.1007/s10750-010-0171-5. | Detail

  19. Pacala, S., R. A. Birdsey, S. D. Bridgham, R. T. Conant, K. Davis, B. Hales, R. A. Houghton, J. C. Jenkins, M. Johnston, G. Marland, and K. Paustian, 2007: Ch. 3: The North American carbon budget past and present. The First State of the Carbon Cycle Report (SOCCR): The North American Carbon Budget and Implications for the Global Carbon Cycle, A.W. King, Dillling, L., Zimmerman, G.P., Fairman, D.M., Houghton, R.A., Marland, G., Rose, A.Z., and Wilbanks, T.J., Eds., 29-170. URL | Detail

  20. Pardo, L. H. et al., 2011: Effects of nitrogen deposition and empirical nitrogen critical loads for ecoregions of the United States. Ecological Applications, 21, 3049-3082, doi:10.1890/10-2341.1. URL | Detail

  21. Peel, J. L., R. Haeuber, V. Garcia, L. Neas, and A. G. Russell, 2012: Impact of nitrogen and climate change interactions on ambient air pollution and human health. Biogeochemistry, doi:10.1007/s10533-012-9782-4. URL | Detail

  22. Porter, E. M., W. D. Bowman, C. M. Clark, J. E. Compton, L. H. Pardo, and J. L. Soong, 2013: Interactive effects of anthropogenic nitrogen enrichment and climate change on terrestrial and aquatic biodiversity. Biogeochemistry, 114, 93-120, doi:10.1007/s10533-012-9803-3. URL | Detail

  23. Rabalais, N. N., R. E. Turner, R. J. Diaz, and D. Justic, 2009: Global change and eutrophication of coastal waters. ICES Journal of Marine Science, 66, 1528-1537, doi:10.1093/icesjms/fsp047. URL | Detail

  24. Shindell, D. et al., 2012: Simultaneously mitigating near-term climate change and improving human health and food security. Science, 335, 183-189, doi:10.1126/science.1210026. | Detail

  25. Smith, V. H., and D. W. Schindler, 2009: Eutrophication science: Where do we go from here? Trends in Ecology & Evolution, 24, 201-207, doi:10.1016/j.tree.2008.11.009. | Detail

  26. Suddick, E. C., P. Whitney, A. R. Townsend, and E. A. Davidson, 2013: The role of nitrogen in climate change and the impacts of nitrogen–climate interactions in the United States: Foreword to thematic issue. Biogeochemistry, 114, 1-10, doi:10.1007/s10533-012-9795-z. URL | Detail

  27. Townsend, A. R., and S. Porder, 2012: Agricultural legacies, food production and its environmental consequences. Proceedings of the National Academy of Sciences, 109, 5917-5918, doi:10.1073/pnas.1203766109. <Go to ISI>://WOS:000303246100014 | Detail

The National Climate Assessment summarizes the impacts of climate change on the United States, now and in the future.

A team of more than 300 experts guided by a 60-member Federal Advisory Committee produced the report, which was extensively reviewed by the public and experts, including federal agencies and a panel of the National Academy of Sciences.

United States Global Change Research Program logo United States Global Change Research Program participating agency logos