


Water Quality Risks to Lakes and Rivers
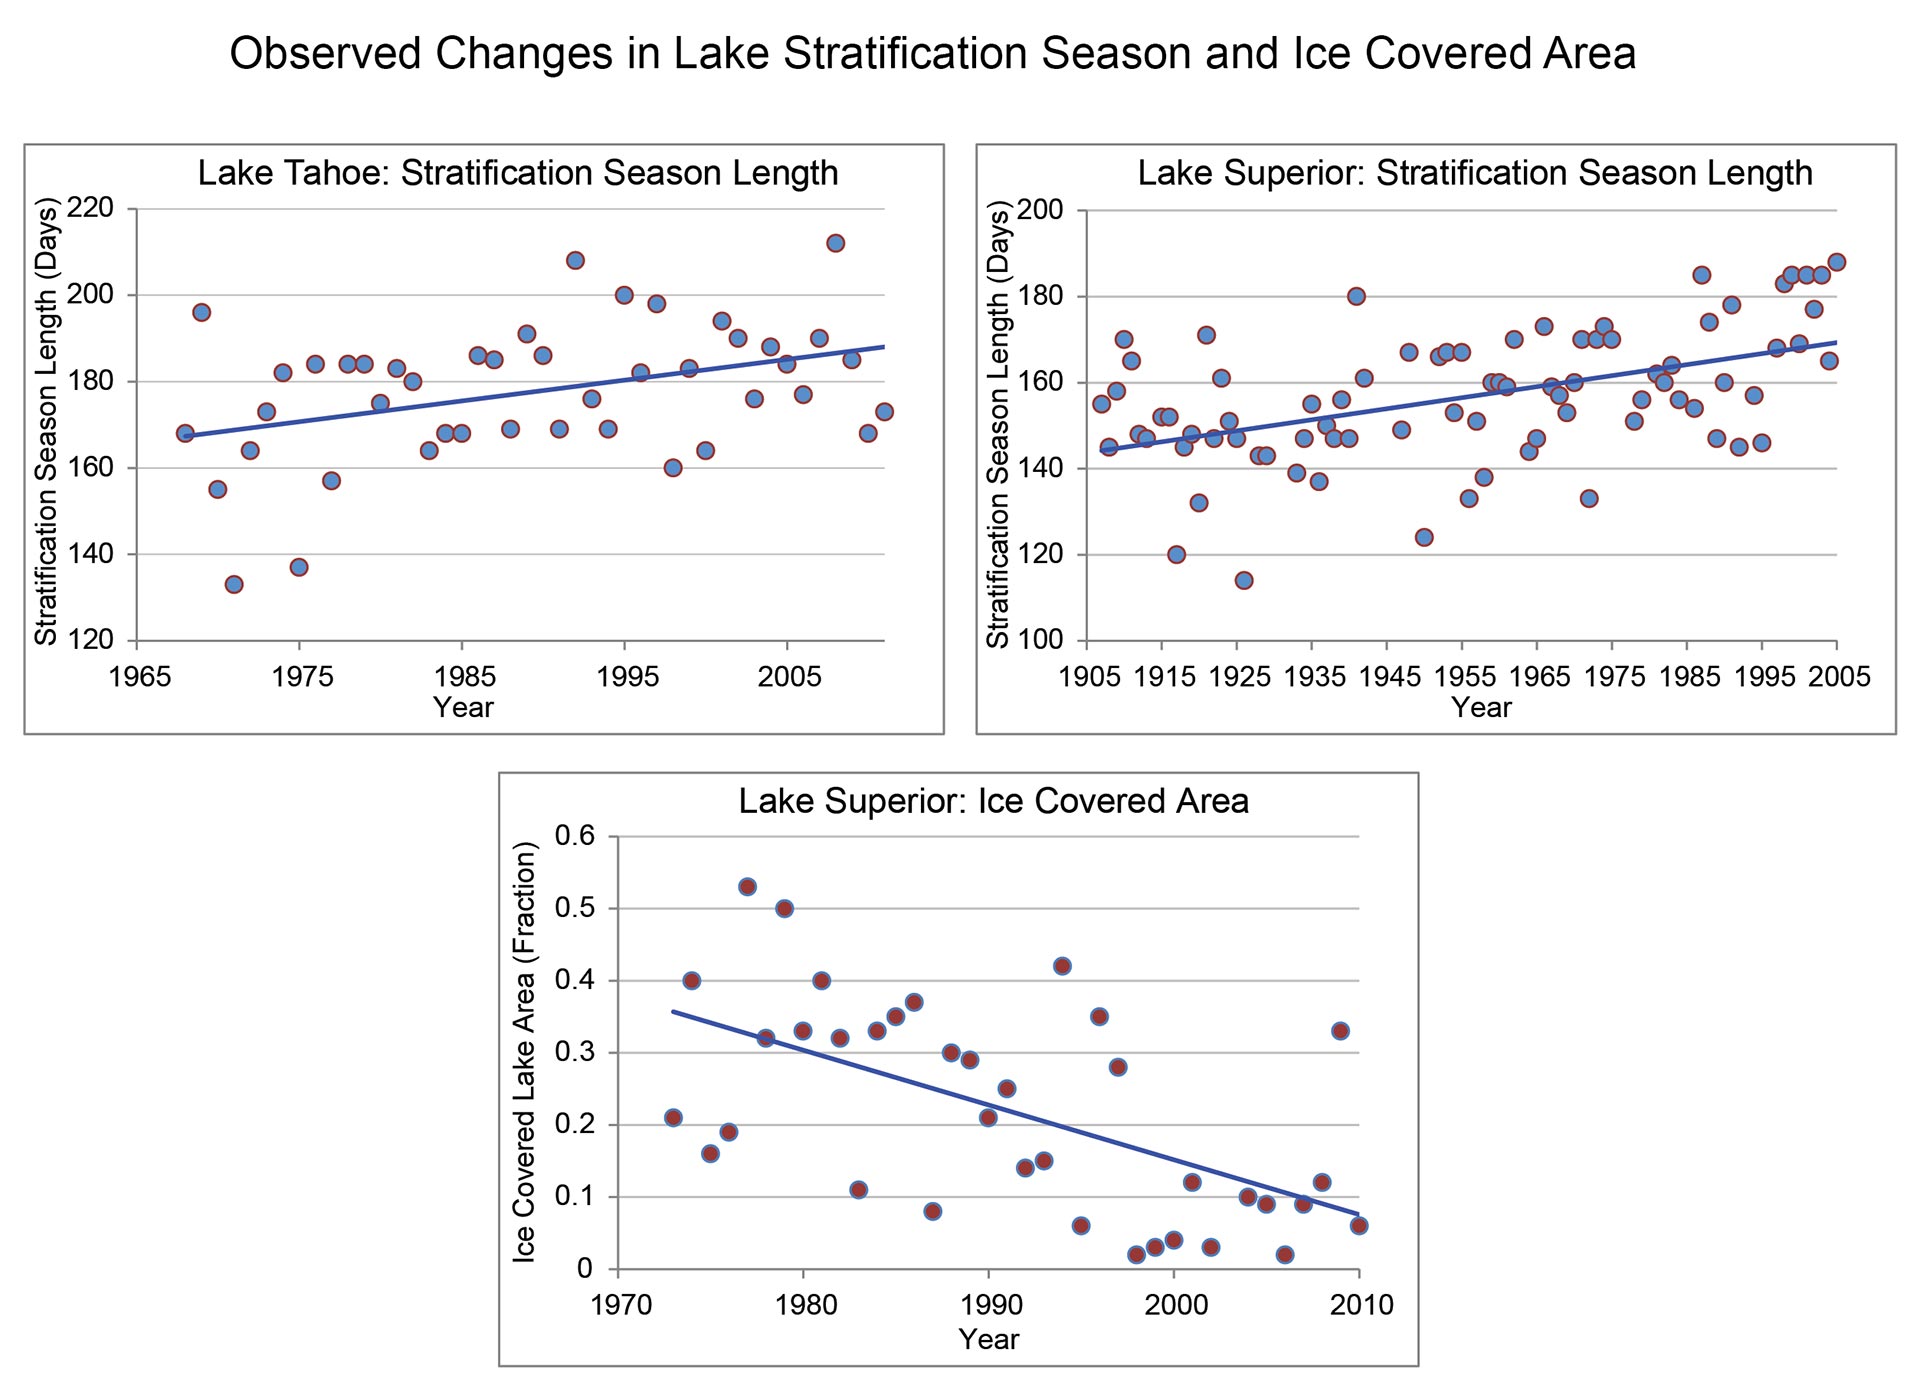
Water temperature has been increasing in some rivers.3 The length of the season that lakes and reservoirs are thermally stratified (with separate density layers) is increasing with increased air and water temperatures.4,5,6 In some cases, seasonal mixing may be eliminated in shallow lakes, decreasing dissolved oxygen and leading to excess concentrations of nutrients (nitrogen and phosphorous), heavy metals (such as mercury), and other toxins in lake waters.4,5,6
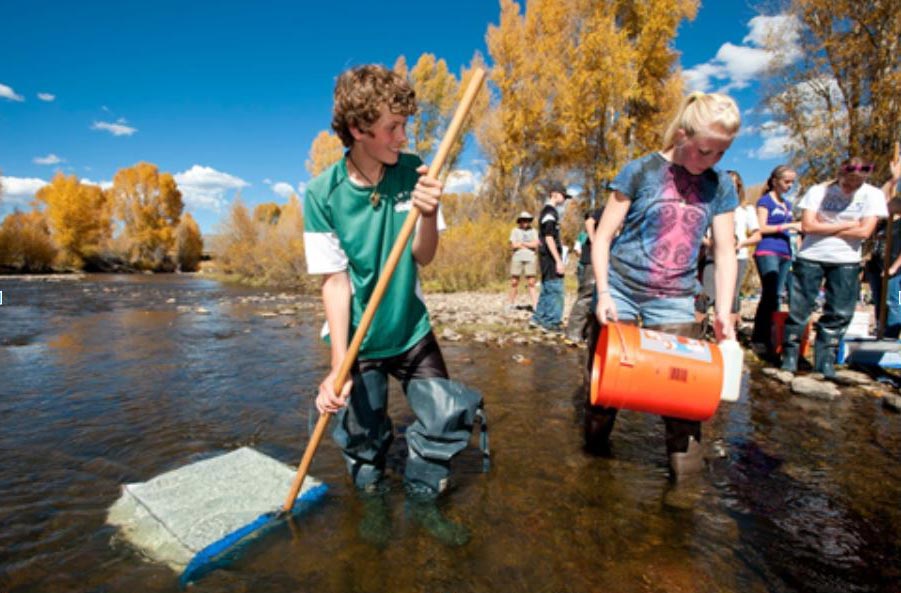
Increasing air and water temperatures, more intense precipitation and runoff, and intensifying droughts can decrease water quality in many ways. Here, middle school students in Colorado learn about water quality.
Lower and more persistent low flows under drought conditions as well as higher flows during floods can worsen water quality. Increasing precipitation intensity, along with the effects of wildfires and fertilizer use, are increasing sediment, nutrient, and contaminant loads in surface waters used by downstream water users7,8 and ecosystems. Mineral weathering products, like calcium, magnesium, sodium, and silicon and nitrogen loads9,10 have been increasing with higher streamflows.11 Changing land cover, flood frequencies, and flood magnitudes are expected to increase mobilization of sediments in large river basins.12 Changes in sediment transport are expected to vary regionally and by land-use type, with potentially large increases in some areas,13 resulting in alterations to reservoir storage and river channels, affecting flooding, navigation, water supply, and dredging. Increased frequency and duration of droughts, and associated low water levels, increase nutrient concentrations and residence times in streams, potentially increasing the likelihood of harmful algal blooms and low oxygen conditions.14 Concerns over such impacts and their potential link to climate change are rising for many U.S. regions including the Great Lakes,15 Chesapeake Bay,16 and the Gulf of Mexico.9,10,11 Strategies aiming to reduce sediment, nutrient, and contaminant loads at the source remain the most effective management responses.17
Relationship between Historical and Projected Water Cycle Changes
Natural climate variations occur on essentially all time scales from days to millennia, and the water cycle varies in much the same way. Observations of changes in the water cycle over time include responses to natural hydroclimatic variability as well as other, more local, human influences (like dam building or land-use changes), or combinations of these influences with human-caused climate change. Some recent studies have attributed specific observed changes in the water cycle to human-induced climate change (for example, Barnett et al. 200818). For many other water cycle variables and impacts, the observed and projected responses are consistent with those expected by human-induced climate change and other human influences. Research aiming to formally attribute these responses to their underlying causes is ongoing.
Flood Factors and Flood Types
A flood is defined as any high flow, overflow, or inundation by water that causes or threatens damage.19 Floods are caused or amplified by both weather- and human-related factors. Major weather factors include heavy or prolonged precipitation, snowmelt, thunderstorms, storm surges from hurricanes, and ice or debris jams. Human factors include structural failures of dams and levees, inadequate drainage, and land cover alterations (such as pavement or deforestation) that reduce the capacity of the land surface to absorb water. Increasingly, humanity is also adding to weather-related factors, as human-induced warming increases heavy downpours, causes more extensive storm surges due to sea level rise, and leads to more rapid spring snowmelt.
Worldwide, from 1980 to 2009, floods caused more than 500,000 deaths and affected more than 2.8 billion people.20 In the U.S., floods caused 4,586 deaths from 1959 to 200521 while property and crop damage averaged nearly $8 billion per year (in 2011 dollars) over 1981 through 2011.19 The risks from future floods are significant, given expanded development in coastal areas and floodplains, unabated urbanization, land-use changes, and human-induced climate change.20
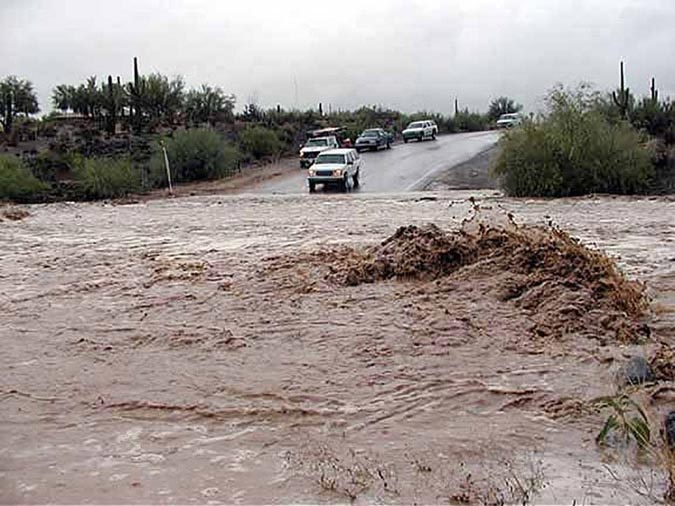
Flash Flooding, Cave Creek, Arizona
Major flood types include flash, urban, riverine, and coastal flooding:
Flash floods occur in small and steep watersheds and waterways and can be caused by short-duration intense precipitation, dam or levee failure, or collapse of debris and ice jams. Snow cover and frozen ground conditions can exacerbate flash flooding during winter and early spring by increasing the fraction of precipitation that runs off. Flash floods develop within minutes or hours of the causative event, and can result in severe damage and loss of life due to high water velocity, heavy debris load, and limited warning. Most flood-related deaths in the U.S. are associated with flash floods.
Urban flooding can be caused by short-duration very heavy precipitation. Urbanization creates large areas of impervious surfaces (such as roads, pavement, parking lots, and buildings) and increases immediate runoff. Stormwater drainage removes excess surface water as quickly as possible, but heavy downpours can exceed the capacity of drains and cause urban flooding.
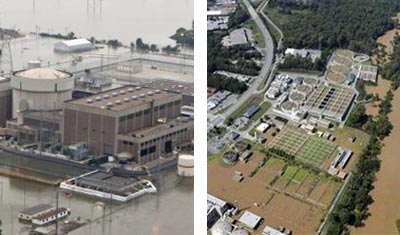
In many regions, infrastructure is currently vulnerable to flooding, as demonstrated in these photos. Left: The Fort Calhoun Nuclear Power Plant in eastern Nebraska was surrounded by a Missouri River flood on June 8, 2011, that also affected Louisiana, Mississippi, Missouri, Illinois, Kentucky, Tennessee, and Arkansas. Right: The R.M. Clayton sewage treatment plant in Atlanta, Georgia, September 23, 2009, was engulfed by floodwaters forcing it to shut down and resulting in the discharge of raw sewage into the Chattahoochee River. Flooding also disrupts road and rail transportation, and inland navigation.
Flash floods and urban flooding are directly linked to heavy precipitation and are expected to increase as a result of projected increases in heavy precipitation events. In mountainous watersheds, such increases may be partially offset in winter and spring due to projected snowpack reduction.
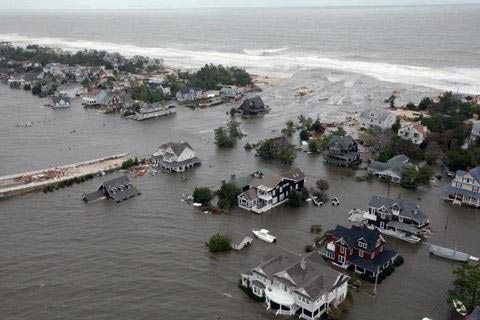
Hurricane Sandy coastal flooding in Mantoloking, N.J.
Riverine flooding occurs when surface water drains from a watershed into a stream or a river exceeds channel capacity, overflows the banks, and inundates adjacent low lying areas. Riverine flooding is commonly associated with large watersheds and rivers, while flash and urban flooding occurs in smaller natural or urban watersheds. Because heavy precipitation is often localized, riverine flooding typically results from multiple heavy precipitation events over periods of several days, weeks, or even months. In large basins, existing soil moisture conditions and evapotranspiration rates also influence the onset and severity of flooding, as runoff increases with wetter soil and/or lower evapotranspiration conditions. Snow cover and frozen ground conditions can also exacerbate riverine flooding during winter and spring by increasing runoff associated with rain-on-snow events and by snowmelt, although these effects may diminish in the long term as snow accumulation decreases due to warming. Since riverine flooding depends on precipitation as well as many other factors, projections about changes in frequency or intensity are more uncertain than with flash and urban flooding.
Coastal flooding is predominantly caused by storm surges that accompany hurricanes and other storms. Low storm pressure creates strong winds that create and push large sea water domes, often many miles across, toward the shore. The approaching domes can raise the water surface above normal tide levels (storm surge) by more than 25 feet, depending on various storm and shoreline factors. Inundation, battering waves, and floating debris associated with storm surge can cause deaths, widespread infrastructure damage (to buildings, roads, bridges, marinas, piers, boardwalks, and sea walls), and severe beach erosion. Storm-related rainfall can also cause inland flooding (flash, urban, or riverine) if, after landfall, the storm moves slowly or stalls over an area. Inland flooding can occur close to the shore or hundreds of miles away and is responsible for more than half of the deaths associated with tropical storms.19 Climate change affects coastal flooding through sea level rise and storm surge, increases in heavy rainfall during hurricanes and other storms, and related increases in flooding in coastal rivers.
In some locations, early warning systems have helped reduce deaths, although property damage remains considerable (Ch. 28: Adaptation). Further improvements can be made by more effective communication strategies and better land-use planning.20
