This website is the digital version of the 2014 National Climate Assessment, produced in collaboration with the U.S. Global Change Research Program.

For the official version, please refer to the PDF in the downloads section. The downloadable PDF is the official version of the 2014 National Climate Assessment.

Credits | Site Map

Search Options

X

Search form

Top

Welcome to the National Climate Assessment

The National Climate Assessment summarizes the impacts of climate change on the United States, now and in the future.

A team of more than 300 experts guided by a 60-member Federal Advisory Committee produced the report, which was extensively reviewed by the public and experts, including federal agencies and a panel of the National Academy of Sciences.

Explore the effects of climate change
United States Global Change Research Program logo
United States Department of Agriculture logo United States Department of Commerce logo United States Department of Defense logo United States Department of Energy logo United States Department of Health and Human Services logo United States Department of the Interior logo United States Department of State logo United States Department of Transportation logo United States Environmental Protection Agency logo National Aeronautics and Space Administration logo National Science Foundation logo Smithsonian Institution logo United States Agency for International Development logo

Frost-Free Season

The length of the frost-free season (and the corresponding growing season) has been increasing nationally since the 1980s and is projected to continue to lengthen.

Explore changes in the frost-free season.

Next

Convening Lead Authors

John Walsh, University of Alaska Fairbanks

Donald Wuebbles, University of Illinois

Lead Authors

Katharine Hayhoe, Texas Tech University

James Kossin, NOAA, National Climatic Data Center

Kenneth Kunkel, CICS-NC, North Carolina State Univ., NOAA National Climatic Data Center

Graeme Stephens, NASA Jet Propulsion Laboratory

Peter Thorne, Nansen Environmental and Remote Sensing Center

Russell Vose, NOAA National Climatic Data Center

Michael Wehner, Lawrence Berkeley National Laboratory

Josh Willis, NASA Jet Propulsion Laboratory

Contributing Authors

David Anderson, NOAA, National Climatic Data Center

Scott Doney, Woods Hole Oceanographic Institution

Richard Feely, NOAA Pacific Marine Environmental Laboratory

Paula Hennon, CICS-NC, North Carolina State Univ., NOAA National Climatic Data Center

Viatcheslav Kharin, Canadian Centre for Climate Modelling and Analysis, Environment Canada

Thomas Knutson, NOAA Geophysical Fluid Dynamics Laboratory

Felix Landerer, NASA Jet Propulsion Laboratory

Tim Lenton, Exeter University

John Kennedy, UK Meteorological Office

Richard Somerville, Scripps Institution of Oceanography, Univ. of California, San Diego

Introduction

This chapter summarizes how climate is changing, why it is changing, and what is projected for the future. While the focus is on changes in the United States, the need to provide context sometimes requires a broader geographical perspective. Additional geographic detail is presented in the regional chapters of this report. Further details on the topics covered by this chapter are provided in the Climate Science Supplement and Frequently Asked Questions Appendices.

The chapter presents 12 key messages about our changing climate, together with supporting evidence for those messages. The discussion of each key message begins with a summary of recent variations or trends, followed by projections of the corresponding changes for the future.

Key Message 4: Lengthening Frost-free Season

The length of the frost-free season (and the corresponding growing season) has been increasing nationally since the 1980s, with the largest increases occurring in the western United States, affecting ecosystems and agriculture. Across the United States, the growing season is projected to continue to lengthen.

Supporting Evidence
close

Supporting Evidence

Process for Developing Key Messages

Development of the key messages involved discussions of the lead authors and accompanying analyses conducted via one in-person meeting plus multiple teleconferences and email exchanges from February thru September 2012. The authors reviewed 80 technical inputs provided by the public, as well as other published literature, and applied their professional judgment.

Key message development also involved the findings from four special workshops that related to the latest scientific understanding of climate extremes. Each workshop had a different theme related to climate extremes, had approximately 30 attendees (the CMIP5 meeting had more than 100), and the workshops resulted in a paper.5 The first workshop was held in July 2011, titled Monitoring Changes in Extreme Storm Statistics: State of Knowledge.6 The second was held in November 2011, titled Forum on Trends and Causes of Observed Changes in Heatwaves, Coldwaves, Floods, and Drought.7 The third was held in January 2012, titled Forum on Trends in Extreme Winds, Waves, and Extratropical Storms along the Coasts.8 The fourth, the CMIP5 results workshop, was held in March 2012 in Hawai‘i, and resulted in an analysis of CMIP5 results relative to climate extremes in the United States.5

The Chapter Author Team’s discussions were supported by targeted consultation with additional experts. Professional expertise and judgment led to determining “key vulnerabilities.” A consensus-based approach was used for final key message selection.

Description of evidence base

The key message and supporting text summarizes extensive evidence documented in the climate science peer-reviewed literature. Technical Input reports (82) on a wide range of topics were also reviewed; they were received as part of the Federal Register Notice solicitation for public input.

Nearly all studies to date published in the peer-reviewed literature (for example, Dragoni et al. 2011;1 EPA 2012;2 Jeong et al. 20113) agree that the frost-free and growing seasons have lengthened. This is most apparent in the western United States. Peer-reviewed studies also indicate that continued lengthening will occur if concentrations of heat-trapping gases continue to rise. The magnitude of future changes based on model simulations is large in the context of historical variations.

Evidence that the length of the frost-free season is lengthening is based on extensive analysis of daily minimum temperature observations from the U.S. Cooperative Observer Network. The geographic variations in increasing number of frost-free days are similar to the regional variations in mean temperature. Separate analysis of surface data also indicates a trend towards an earlier onset of spring.2,1,3,4

New information and remaining uncertainties

A key issue (uncertainty) is the potential effect on observed trends of climate monitoring station inhomogeneities (differences), particularly those arising from instrumentation changes. A second key issue is the extent to which observed regional variations (more lengthening in the west/less in the east) will persist into the future.

Local temperature biases in climate models contribute to the uncertainty in projections.

Viable avenues to improving the information base are to investigate the sensitivity of observed trends to potential biases introduced by station inhomogeneities and to investigate the causes of observed regional variations.

Assessment of confidence based on evidence

Given the evidence base and remaining uncertainties, confidence is very high that the length of the frost-free season (also referred to as the growing season) has been increasing nationally since the 1980s, with the largest increases occurring in the western U.S, affecting ecosystems, gardening, and agriculture. Given the evidence base, confidence is very high that across the U.S., the growing season is projected to continue to lengthen.

Confidence Level

Very High

Strong evidence (established theory, multiple sources, consistent results, well documented and accepted methods, etc.), high consensus

High

Moderate evidence (several sources, some consistency, methods vary and/or documentation limited, etc.), medium consensus

Medium

Suggestive evidence (a few sources, limited consistency, models incomplete, methods emerging, etc.), competing schools of thought

Low

Inconclusive evidence (limited sources, extrapolations, inconsistent findings, poor documentation and/or methods not tested, etc.), disagreement or lack of opinions among experts

Lengthening Frost-free Season

The length of the frost-free season (and the corresponding growing season) is a major determinant of the types of plants and crops that do well in a particular region. The frost-free season length has been gradually increasing since the 1980s.2 The last occurrence of 32°F in the spring has been occurring earlier in the year, and the first occurrence of 32°F in the fall has been happening later. During 1991-2011, the average frost-free season was about 10 days longer than during 1901-1960. These observed climate changes have been mirrored by changes in the biosphere, including increases in forest productivity1,9 and satellite-derived estimates of the length of the growing season.3 A longer growing season provides a longer period for plant growth and productivity and can slow the increase in atmospheric CO2 concentrations through increased CO2 uptake by living things and their environment.10 The longer growing season can increase the growth of beneficial plants (such as crops and forests) as well as undesirable ones (such as ragweed).4 In some cases where moisture is limited, the greater evaporation and loss of moisture through plant transpiration (release of water from plant leaves) associated with a longer growing season can mean less productivity because of increased drying11 and earlier and longer fire seasons.

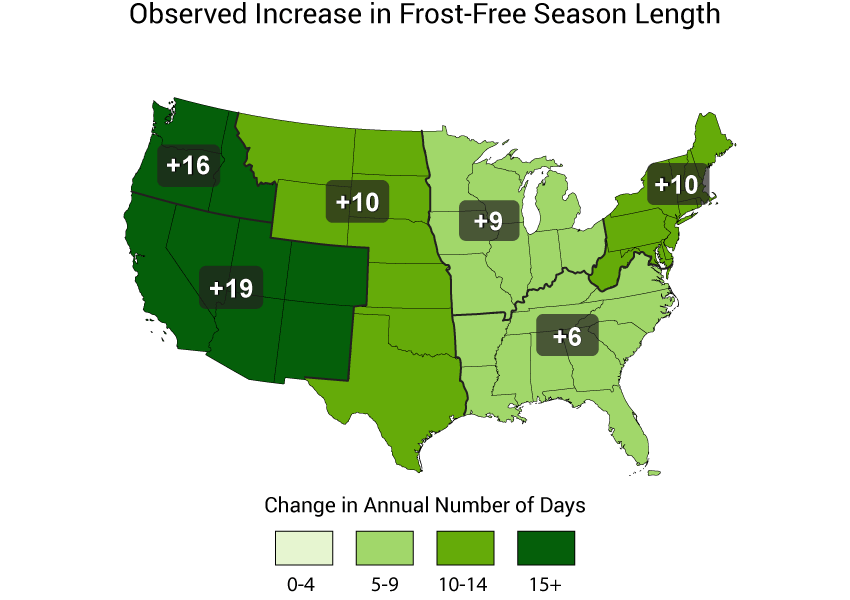
The lengthening of the frost-free season has been somewhat greater in the western U.S. than the eastern United States,12 increasing by 2 to 3 weeks in the Northwest and Southwest, 1 to 2 weeks in the Midwest, Great Plains, and Northeast, and slightly less than 1 week in the Southeast. These differences mirror the overall trend of more warming in the north and west and less warming in the Southeast.

Figure 2.10: Observed Increase in Frost-Free Season Length

Observed Increase in Frost-Free Season Length

Figure 2.10: The frost-free season length, defined as the period between the last occurrence of 32°F in the spring and the first occurrence of 32°F in the fall, has increased in each U.S. region during 1991-2012 relative to 1901-1960. Increases in frost-free season length correspond to similar increases in growing season length. (Figure source: NOAA NCDC / CICS-NC).

Details/Download

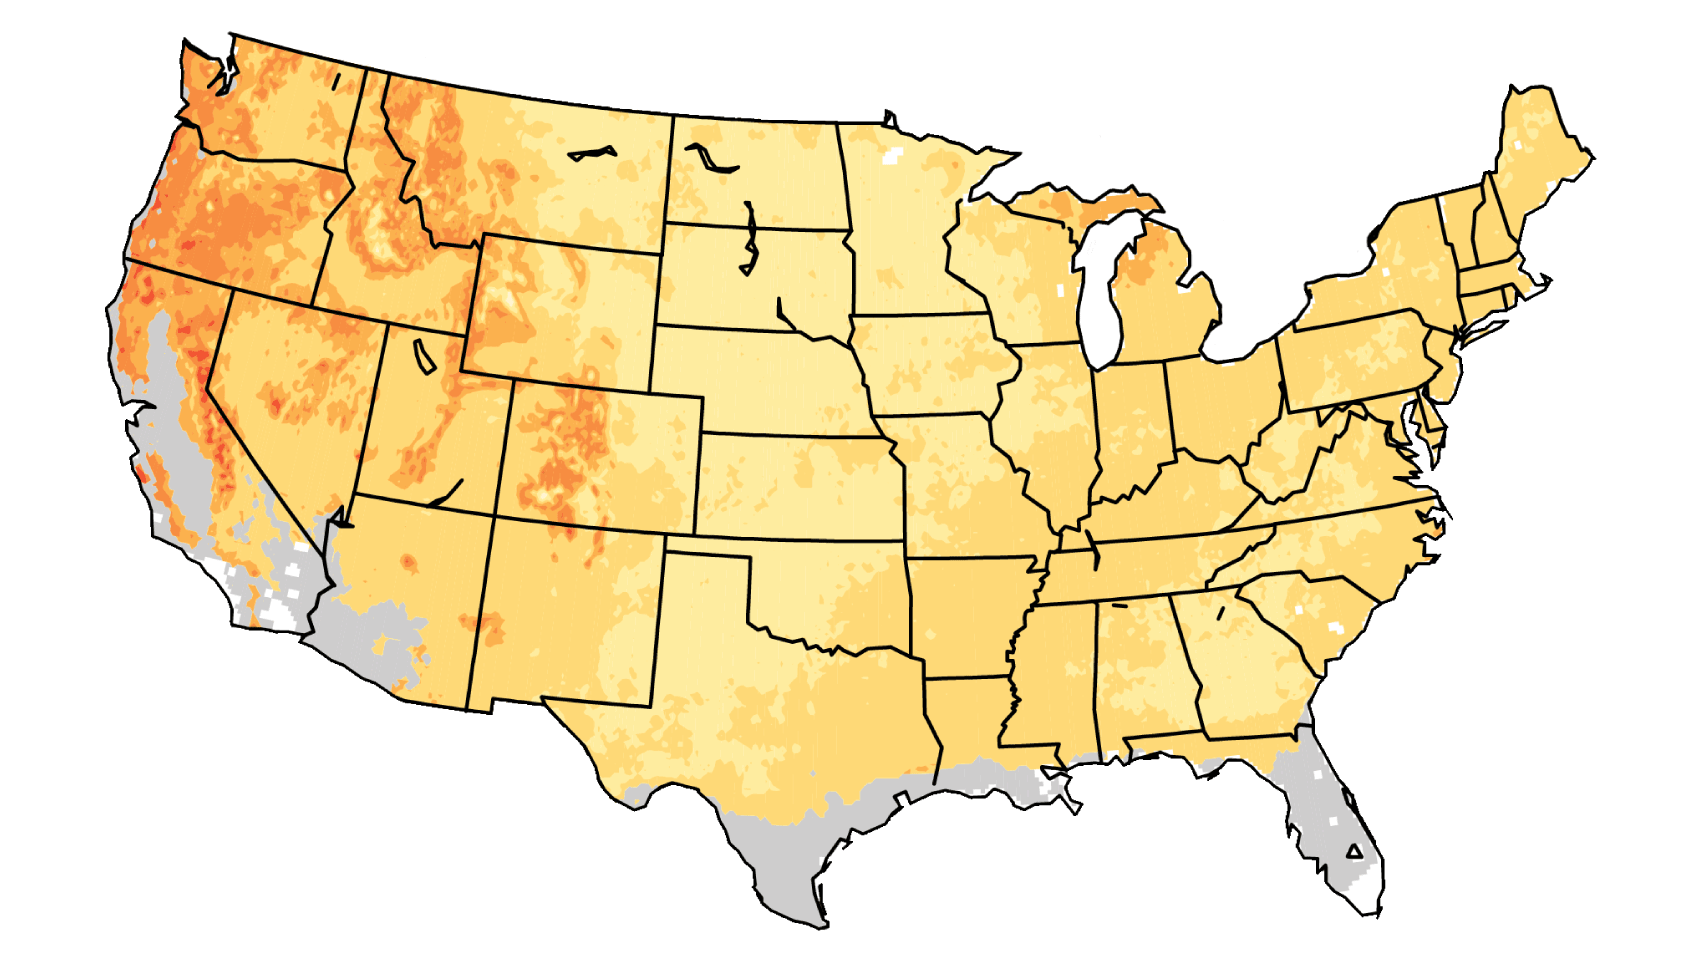
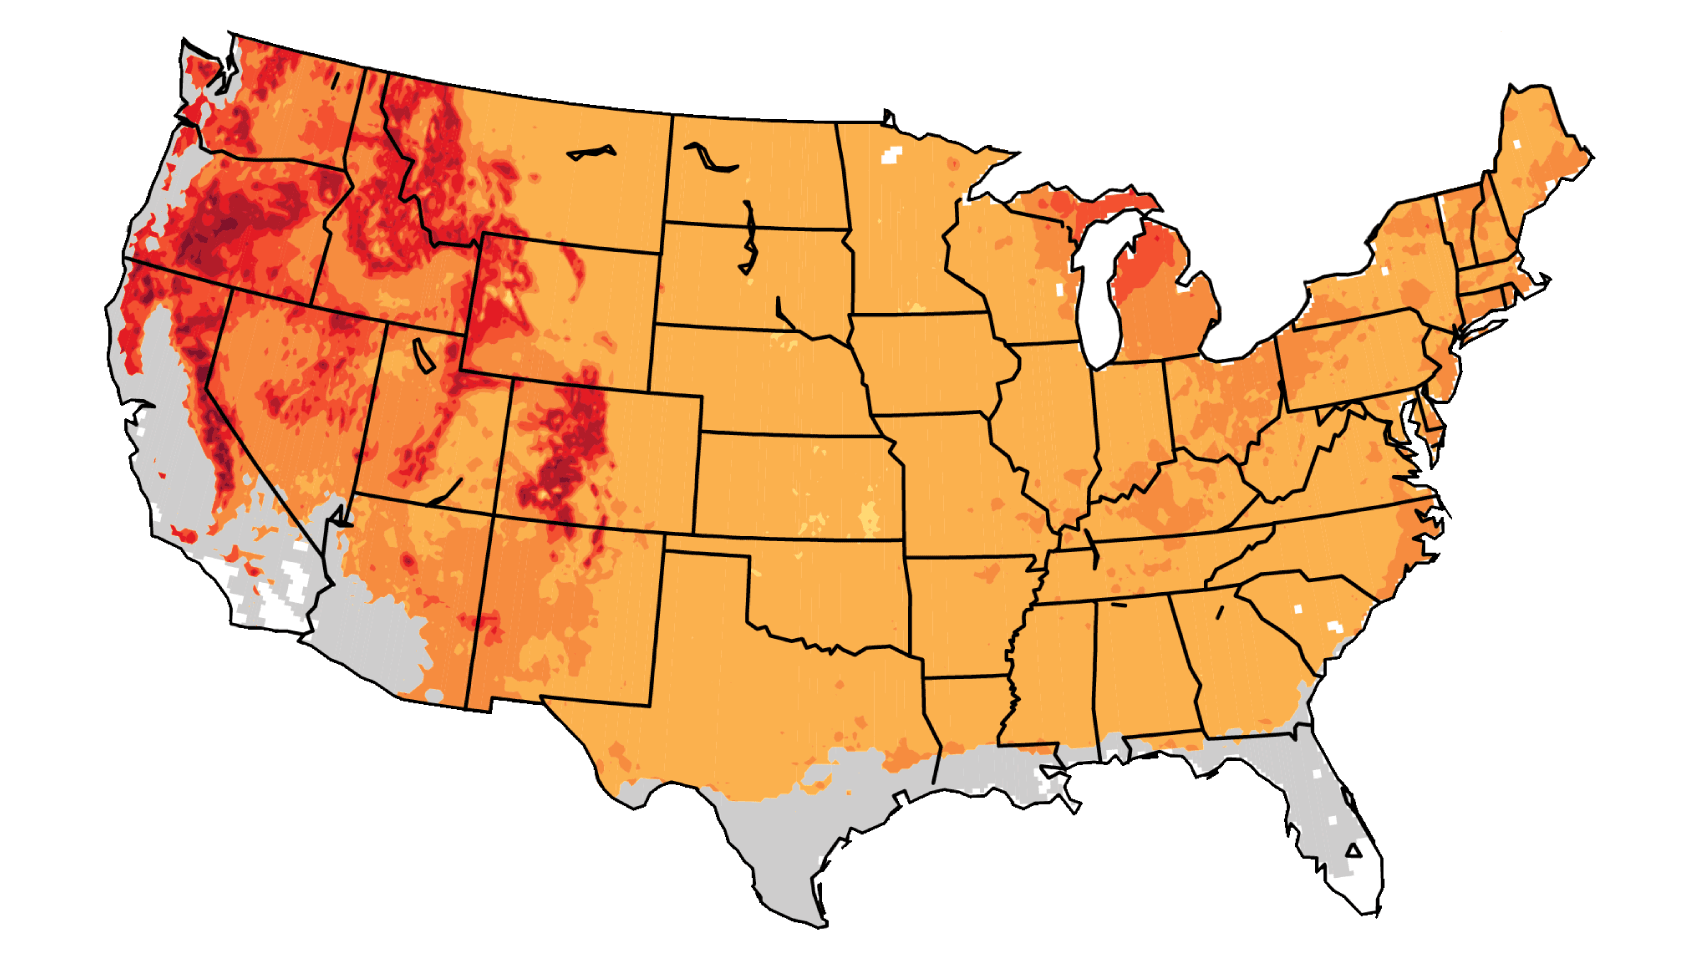
In a future in which heat-trapping gas emissions continue to grow, increases of a month or more in the lengths of the frost-free and growing seasons are projected across most of the U.S. by the end of the century, with slightly smaller increases in the northern Great Plains. The largest increases in the frost-free season (more than 8 weeks) are projected for the western U.S., particularly in high elevation and coastal areas. The increases will be considerably smaller if heat-trapping gas emissions are reduced, although still substantial. These increases are projected to be much greater than the normal year-to-year variability experienced today. The projected changes also imply that the southern boundary of the seasonal freeze zone will move northward, with increasing frequencies of years without subfreezing temperatures in the most southern parts of the United States.

Figure 2.11: Projected Changes in Frost-Free Season Length

Projected Changes in Frost-Free Season Length

Lower Emissions (B1)Higher Emissions (A2)

Figure 2.11: The maps show projected increases in frost-free season length for the last three decades of this century (2070-2099 as compared to 1971-2000) under two emissions scenarios, one in which heat-trapping gas emissions continue to grow (A2) and one in which emissions peak in 2050 (B1). Increases in the frost-free season correspond to similar increases in the growing season. White areas are projected to experience no freezes for 2070-2099, and gray areas are projected to experience more than 10 frost-free years during the same period. (Figure source: NOAA NCDC / CICS-NC).

Details/Download

References

  1. Dragoni, D., H. P. Schmid, C. A. Wayson, H. Potter, C. S. B. Grimmond, and J. C. Randolph, 2011: Evidence of increased net ecosystem productivity associated with a longer vegetated season in a deciduous forest in south-central Indiana, USA. Global Change Biology, 17, 886-897, doi:10.1111/j.1365-2486.2010.02281.x. | Detail

  2. ,, 2012: Climate Change Indicators in the United States, 2nd Edition. 84 pp., U.S. Environmental Protection Agency, Washington, D.C. URL | Detail

  3. Hu, J. I. A., D. J. P. Moore, S. P. Burns, and R. K. Monson, 2010: Longer growing seasons lead to less carbon sequestration by a subalpine forest. Global Change Biology, 16, 771-783, doi:10.1111/j.1365-2486.2009.01967.x. URL | Detail

  4. Jeong, S. J., C. H. Ho, H. J. Gim, and M. E. Brown, 2011: Phenology shifts at start vs. end of growing season in temperate vegetation over the Northern Hemisphere for the period 1982-2008. Global Change Biology, 17, 2385-2399, doi:10.1111/j.1365-2486.2011.02397.x. URL | Detail

  5. Karl, T. R., J. T. Melillo, and T. C. Peterson, 2009: Global Climate Change Impacts in the United States. T.R. Karl, Melillo, J.T., and Peterson, T.C., Eds. Cambridge University Press, 189 pp. URL | Detail

  6. Kunkel, K. E. et al., 2013: Monitoring and understanding trends in extreme storms: State of knowledge. Bulletin of the American Meteorological Society, 94, doi:10.1175/BAMS-D-11-00262.1. URL | Detail

  7. McMahon, S. M., G. G. Parker, and D. R. Miller, 2010: Evidence for a recent increase in forest growth. Proceedings of the National Academy of Sciences, 107, 3611-3615, doi:10.1073/pnas.0912376107. URL | Detail

  8. Peterson, T. C. et al., 2013: Monitoring and understanding changes in heat waves, cold waves, floods and droughts in the United States: State of knowledge. Bulletin of the American Meteorological Society, 94, 821-834, doi:10.1175/BAMS-D-12-00066.1. URL | Detail

  9. Peñuelas, J., T. Rutishauser, and I. Filella, 2009: Phenology feedbacks on climate change. Science, 324, 887-888, doi:10.1126/science.1173004. URL | Detail

  10. Vose, R. S. et al., 2013: Monitoring and understanding changes in extremes: Extratropical storms, winds, and waves. Bulletin of the American Meteorological Society, in press, doi:10.1175/BAMS-D-12-00162.1. URL | Detail

  11. Wuebbles, D. J., G. Meehl, K. Hayhoe, T. R. Karl, K. Kunkel, B. Santer, M. Wehner, B. Colle, E. M. Fischer, R. Fu, A. Goodman, E. Janssen, H. Lee, W. Li, L. N. Long, S. Olsen, A. J. Sheffield, and L. Sun, 2013: CMIP5 climate model analyses: Climate extremes in the United States. Bulletin of the American Meteorological Society, in press, doi:10.1175/BAMS-D-12-00172.1. URL | Detail

  12. Ziska, L. et al., 2011: Recent warming by latitude associated with increased length of ragweed pollen season in central North America. Proceedings of the National Academy of Sciences, 108, 4248-4251, doi:10.1073/pnas.1014107108. URL | Detail

The National Climate Assessment summarizes the impacts of climate change on the United States, now and in the future.

A team of more than 300 experts guided by a 60-member Federal Advisory Committee produced the report, which was extensively reviewed by the public and experts, including federal agencies and a panel of the National Academy of Sciences.

United States Global Change Research Program logo United States Global Change Research Program participating agency logos