This website is the digital version of the 2014 National Climate Assessment, produced in collaboration with the U.S. Global Change Research Program.

For the official version, please refer to the PDF in the downloads section. The downloadable PDF is the official version of the 2014 National Climate Assessment.

Credits | Site Map

Search Options

X

Search form

Top

Welcome to the National Climate Assessment

The National Climate Assessment summarizes the impacts of climate change on the United States, now and in the future.

A team of more than 300 experts guided by a 60-member Federal Advisory Committee produced the report, which was extensively reviewed by the public and experts, including federal agencies and a panel of the National Academy of Sciences.

Explore the effects of climate change
United States Global Change Research Program logo
United States Department of Agriculture logo United States Department of Commerce logo United States Department of Defense logo United States Department of Energy logo United States Department of Health and Human Services logo United States Department of the Interior logo United States Department of State logo United States Department of Transportation logo United States Environmental Protection Agency logo National Aeronautics and Space Administration logo National Science Foundation logo Smithsonian Institution logo United States Agency for International Development logo

Extreme Weather

Some extreme weather and climate events have increased in recent decades, and new and stronger evidence confirms that some of these increases are related to human activities.

Explore extreme weather.

Next

Introduction

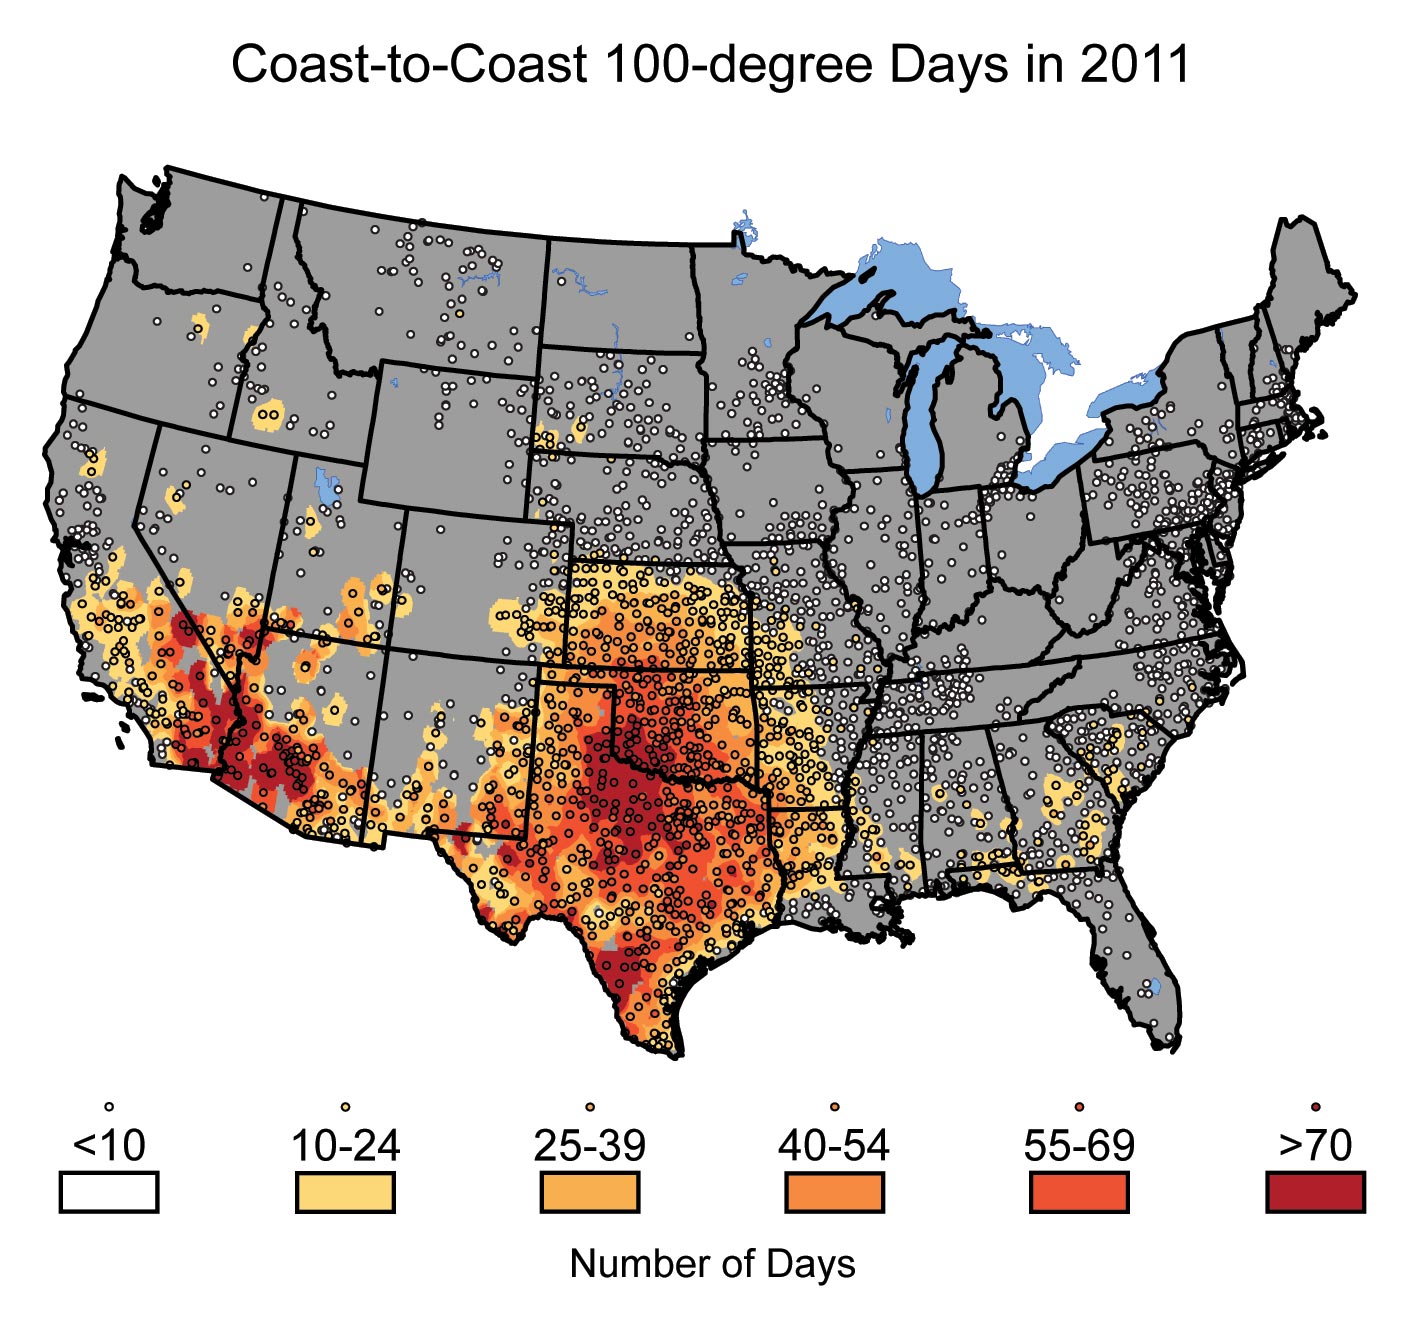
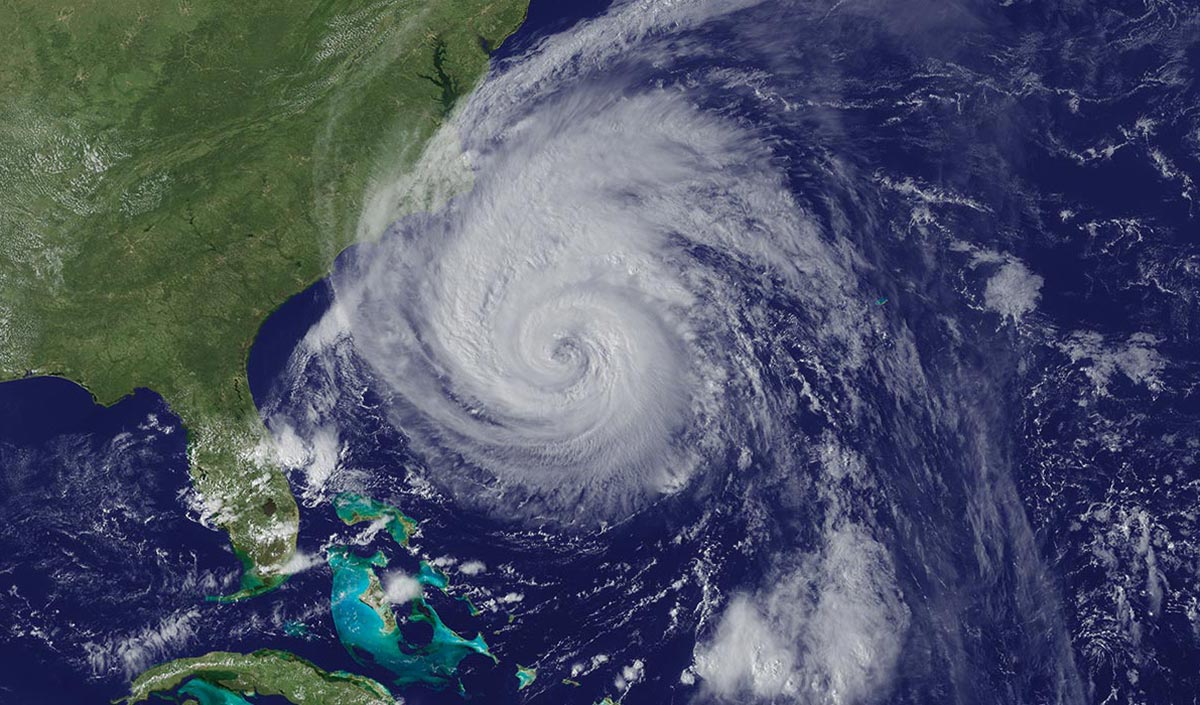
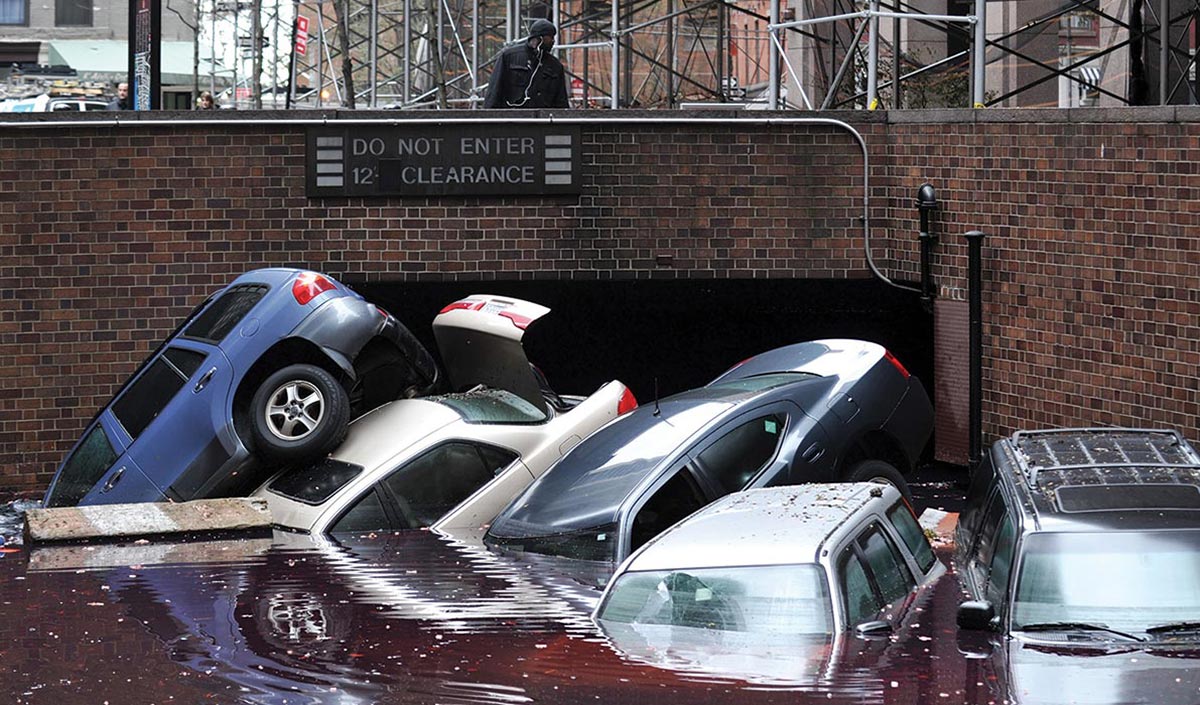
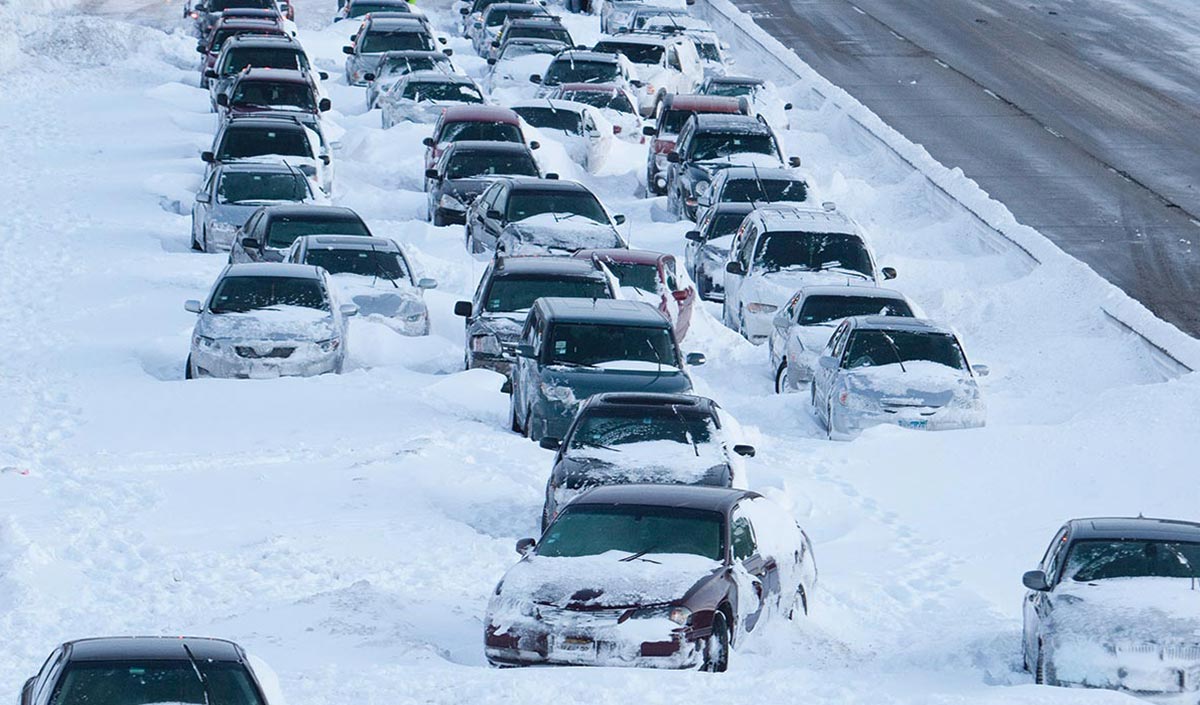
As the world has warmed, that warming has triggered many other changes to the Earth’s climate. Changes in extreme weather and climate events, such as heat waves and droughts, are the primary way that most people experience climate change. Human-induced climate change has already increased the number and strength of some of these extreme events. Over the last 50 years, much of the U.S. has seen increases in prolonged periods of excessively high temperatures, heavy downpours, and in some regions, severe floods and droughts.

Heat Waves

Coast-to-Coast 100-degree Days in 2011 Coast-to-Coast 100-degree Days in 2011 Details/Download

Heat waves are periods of abnormally hot weather lasting days to weeks. The number of heat waves has been increasing in recent years. This trend has continued in 2011 and 2012, with the number of intense heat waves being almost triple the long-term average. The recent heat waves and droughts in Texas (2011) and the Midwest (2012) set records for highest monthly average temperatures. Analyses show that human-induced climate change has generally increased the probability of heat waves.1,2 And prolonged (multi-month) extreme heat has been unprecedented since the start of reliable instrumental records in 1895.

Drought

Texas Summer 2011: Record Heat and Drought Texas Summer 2011: Record Heat and Drought Details/Download

Higher temperatures lead to increased rates of evaporation, including more loss of moisture through plant leaves. Even in areas where precipitation does not decrease, these increases in surface evaporation and loss of water from plants lead to more rapid drying of soils if the effects of higher temperatures are not offset by other changes (such as reduced wind speed or increased humidity).5 As soil dries out, a larger proportion of the incoming heat from the sun goes into heating the soil and adjacent air rather than evaporating its moisture, resulting in hotter summers under drier climatic conditions.6

An example of recent drought occurred in 2011, when many locations in Texas and Oklahoma experienced more than 100 days over 100°F. Both states set new records for the hottest summer since record keeping began in 1895. Rates of water loss, due in part to evaporation, were double the long-term average. The heat and drought depleted water resources and contributed to more than $10 billion in direct losses to agriculture alone.

Heavy Downpours

Heavy downpours are increasing nationally, especially over the last three to five decades. The heaviest rainfall events have become heavier and more frequent, and the amount of rain falling on the heaviest rain days has also increased. Since 1991, the amount of rain falling in very heavy precipitation events has been significantly above average. This increase has been greatest in the Northeast, Midwest, and upper Great Plains – more than 30% above the 1901-1960 average. There has also been an increase in flooding events in the Midwest and Northeast, where the largest increases in heavy rain amounts have occurred.

Observed U.S. Trends in Heavy Precipitation

Observed U.S. Trends in Heavy Precipitation

One measure of heavy precipitation events is a two-day precipitation total that is exceeded on average only once in a 5-year period, also known as the once-in-five-year event. As this extreme precipitation index for 1901-2012 shows, the occurrence of such events has become much more common in recent decades. Changes are compared to the period 1901-1960, and do not include Alaska or Hawai‘i. (Figure source: adapted from Kunkel et al. 20137).

Details/Download

The mechanism driving these changes is well understood. Warmer air can contain more water vapor than cooler air. Global analyses show that the amount of water vapor in the atmosphere has in fact increased due to human-caused warming.8,9,10,11 This extra moisture is available to storm systems, resulting in heavier rainfalls. Climate change also alters characteristics of the atmosphere that affect weather patterns and storms.

Floods

Flooding may intensify in many U.S. regions, even in areas where total precipitation is projected to decline. A flood is defined as any high flow, overflow, or inundation by water that causes or threatens damage.17 Floods are caused or amplified by both weather- and human-related factors. Major weather factors include heavy or prolonged precipitation, snowmelt, thunderstorms, storm surges from hurricanes, and ice or debris jams. Human factors include structural failures of dams and levees, altered drainage, and land-cover alterations (such as pavement).

Major Flood Types

All flood types are affected by climate-related factors, some more than others.

Flash floods occur in small and steep watersheds and waterways and can be caused by short-duration intense precipitation, dam or levee failure, or collapse of debris and ice jams. Most flood-related deaths in the U.S. are associated with flash floods.

Urban flooding can be caused by short-duration very heavy precipitation. Urbanization creates large areas of impervious surfaces (such as roads, pavement, parking lots, and buildings) that increased immediate runoff, and heavy downpours can exceed the capacity of storm drains and cause urban flooding.

Flash floods and urban flooding are directly linked to heavy precipitation and are expected to increase as a result of increases in heavy precipitation events.

River flooding occurs when surface water drained from a watershed into a stream or a river exceeds channel capacity, overflows the banks, and inundates adjacent low lying areas. Riverine flooding depends on precipitation as well as many other factors, such as existing soil moisture conditions and snowmelt.

Coastal flooding is predominantly caused by storm surges that accompany hurricanes and other storms that push large seawater domes toward the shore. Storm surge can cause deaths, widespread infrastructure damage, and severe beach erosion. Storm-related rainfall can also cause inland flooding and is responsible for more than half of the deaths associated with tropical storms.17 Climate change affects coastal flooding through sea level rise and storm surge, and increases in heavy rainfall during storms.

Increasingly, humanity is also adding to weather-related factors, as human-induced warming increases heavy downpours, causes more extensive storm surges due to sea level rise, and leads to more rapid spring snowmelt.

Trends in Flood Magnitude Trends in Flood Magnitude Details/Download

Worldwide, from 1980 to 2009, floods caused more than 500,000 deaths and affected more than 2.8 billion people.18 In the United States, floods caused 4,586 deaths from 1959 to 200519 while property and crop damage averaged nearly 8 billion dollars per year (in 2011 dollars) over 1981 through 2011.17 The risks from future floods are significant, given expanded development in coastal areas and floodplains, unabated urbanization, land-use changes, and human-induced climate change.18

Hurricanes

hurricane

North Atlantic hurricanes have increased in intensity, frequency, and duration since the early 1980s.

There has been a substantial increase in most measures of Atlantic hurricane activity since the early 1980s, the period during which high quality satellite data are available.20,21,22 These include measures of intensity, frequency, and duration as well as the number of strongest (Category 4 and 5) storms. The recent increases in activity are linked, in part, to higher sea surface temperatures in the region that Atlantic hurricanes form in and move through. Numerous factors have been shown to influence these local sea surface temperatures, including natural variability, human-induced emissions of heat-trapping gases, and particulate pollution. Quantifying the relative contributions of natural and human-caused factors is an active focus of research.

cars in storm surge

Storm surges reach farther inland as they ride on top of sea levels that are higher due to warming.

Hurricane development, however, is influenced by more than just sea surface temperature. How hurricanes develop also depends on how the local atmosphere responds to changes in local sea surface temperatures, and this atmospheric response depends critically on the cause of the change.23,24 For example, the atmosphere responds differently when local sea surface temperatures increase due to a local decrease of particulate pollution that allows more sunlight through to warm the ocean, versus when sea surface temperatures increase more uniformly around the world due to increased amounts of human-caused heat-trapping gases.25,26,27,28

By late this century, models, on average, project an increase in the number of the strongest (Category 4 and 5) hurricanes. Models also project greater rainfall rates in hurricanes in a warmer climate, with increases of about 20% averaged near the center of hurricanes.

Change in Other Storms

cars abandoned in show

Heavy snowfalls during winter storms affect transportation systems and other infrastructure.

Winter storms have increased in frequency and intensity since the 1950s,29 and their tracks have shifted northward over the United States.30,31 Other trends in severe storms, including the intensity and frequency of tornadoes, hail, and damaging thunderstorm winds, are uncertain and are being studied intensively. There has been a sizable upward trend in the number of storms causing large financial and other losses.32 However, there are societal contributions to this trend, such as increases in population and wealth.7

References

  1. Ashley, S. T., and W. S. Ashley, 2008: Flood fatalities in the United States. Journal of Applied Meteorology and Climatology, 47, 805-818, doi:10.1175/2007JAMX1611.1. URL | Detail

  2. Bell, G. D., E. S. Blake, C. W. Landsea, T. B. Kimberlain, S. B. Goldenberg, J. Schemm, and R. J. Pasch, 2012: [Tropical cyclones] Atlantic basin [in "State of the Climate in 2011"]. Bulletin of the American Meteorological Society, 93, S99-S105, doi:10.1175/2012BAMSStateoftheClimate.1. URL | Detail

  3. Camargo, S. J., M. Ting, and Y. Kushnir, 2013: Influence of local and remote SST on North Atlantic tropical cyclone potential intensity. Climate Dynamics, 40, 1515-1529, doi:10.1007/s00382-012-1536-4. | Detail

  4. Christidis, N., P. A. Stott, and S. J. Brown, 2011: The role of human activity in the recent warming of extremely warm daytime temperatures. Journal of Climate, 24, 1922-1930, doi:10.1175/2011JCLI4150.1. | Detail

  5. Dai, A., 2006: Recent climatology, variability, and trends in global surface humidity. Journal of Climate, 19, 3589-3606, doi:10.1175/JCLI3816.1. URL | Detail

  6. Doocy, S., A. Daniels, S. Murray, and T. D. Kirsch, 2013: The human impact of floods: A historical review of events 1980-2009 and systematic literature review. PLOS Currents Disasters, doi:10.1371/currents.dis.f4deb457904936b07c09daa98ee8171a. URL | Detail

  7. Duffy, P. B., and C. Tebaldi, 2012: Increasing prevalence of extreme summer temperatures in the U.S. Climatic Change, 111, 487-495, doi:10.1007/s10584-012-0396-6. | Detail

  8. Emanuel, K., and A. Sobel, 2013: Response of tropical sea surface temperature, precipitation, and tropical cyclone-related variables to changes in global and local forcing. Journal of Advances in Modeling Earth Systems, 5, 447-458, doi:10.1002/jame.20032. URL | Detail

  9. Hirsch, R. M., and K. R. Ryberg, 2012: Has the magnitude of floods across the USA changed with global CO2 levels? Hydrological Sciences Journal, 57, 1-9, doi:10.1080/02626667.2011.621895. URL | Detail

  10. Hoerling, M., M. Chen, R. Dole, J. Eischeid, A. Kumar, J. W. Nielsen-Gammon, P. Pegion, J. Perlwitz, X. - W. Quan, and T. Zhang, 2013: Anatomy of an extreme event. Journal of Climate, 26, 2811–2832, doi:10.1175/JCLI-D-12-00270.1. URL | Detail

  11. Kunkel, K. E. et al., 2013: Monitoring and understanding trends in extreme storms: State of knowledge. Bulletin of the American Meteorological Society, 94, doi:10.1175/BAMS-D-11-00262.1. URL | Detail

  12. Landsea, C. W., and J. L. Franklin, 2013: Atlantic hurricane database uncertainty and presentation of a new database format. Monthly Weather Review, 141, 3576-3592, doi:10.1175/MWR-D-12-00254.1. URL | Detail

  13. Mueller, B., and S. I. Seneviratne, 2012: Hot days induced by precipitation deficits at the global scale. Proceedings of the National Academy of Sciences, 109, 12398-12403, doi:10.1073/pnas.1204330109. URL | Detail

  14. ,, 2012: Climate Data Online. National Climatic Data Center. URL | Detail

  15. ,, 2013: Billion Dollar Weather/Climate Disasters. National Oceanic and Atmospheric Administration. URL | Detail

  16. ,, 2013: United States Flood Loss Report - Water Year 2011. 10 pp., National Oceanic and Atmospheric Administration, National Weather Service. URL | Detail

  17. Peterson, T. C. et al., 2013: Monitoring and understanding changes in heat waves, cold waves, floods and droughts in the United States: State of knowledge. Bulletin of the American Meteorological Society, 94, 821-834, doi:10.1175/BAMS-D-12-00066.1. URL | Detail

  18. Ramsay, H. A., and A. H. Sobel, 2011: Effects of relative and absolute sea surface temperature on tropical cyclone potential intensity using a single-column model. Journal of Climate, 24, 183-193, doi:10.1175/2010jcli3690.1. URL | Detail

  19. Santer, B. D., C. Mears, F. J. Wentz, K. E. Taylor, P. J. Gleckler, T. M. L. Wigley, T. P. Barnett, J. S. Boyle, W. Brüggemann, N. P. Gillett, S. A. Klein, G. A. Meehl, T. Nozawa, D. W. Pierce, P. A. Stott, W. M. Washington, and M. F. Wehner, 2007: Identification of human-induced changes in atmospheric moisture content. Proceedings of the National Academy of Sciences, 104, 15248-15253, doi:10.1073/pnas.0702872104. URL | Detail

  20. Sheffield, J., E. F. Wood, and M. L. Roderick, 2012: Little change in global drought over the past 60 years. Nature, 491, 435-438, doi:10.1038/nature11575. URL | Detail

  21. Simmons, A. J., K. M. Willett, P. D. Jones, P. W. Thorne, and D. P. Dee, 2010: Low-frequency variations in surface atmospheric humidity, temperature, and precipitation: Inferences from reanalyses and monthly gridded observational data sets. Journal of Geophysical Research, 115, 1-21, doi:10.1029/2009JD012442. | Detail

  22. Torn, R. D., and C. Snyder, 2012: Uncertainty of tropical cyclone best-track information. Weather and Forecasting, 27, 715-729, doi:10.1175/waf-d-11-00085.1. URL | Detail

  23. Vecchi, G. A., and B. J. Soden, 2007: Effect of remote sea surface temperature change on tropical cyclone potential intensity. Nature, 450, 1066-1070, doi:10.1038/nature06423. | Detail

  24. Vecchi, G. A., A. Clement, and B. J. Soden, 2008: Examining the tropical Pacific's response to global warming. Eos, Transactions, American Geophysical Union, 89, 81-83, doi:10.1029/2008EO090002. | Detail

  25. Villarini, G., and J. A. Smith, 2010: Flood peak distributions for the eastern United States. Water Resources Research, 46, W06504, doi:10.1029/2009wr008395. URL | Detail

  26. Villarini, G., F. Serinaldi, J. A. Smith, and W. F. Krajewski, 2009: On the stationarity of annual flood peaks in the continental United States during the 20th century. Water Resources Research, 45, W08417, doi:10.1029/2008wr007645. URL | Detail

  27. Villarini, G., J. A. Smith, M. Lynn Baeck, and W. F. Krajewski, 2011: Examining flood frequency distributions in the Midwest U.S. JAWRA Journal of the American Water Resources Association, 47, 447-463, doi:10.1111/j.1752-1688.2011.00540.x. URL | Detail

  28. Vose, R. S. et al., 2013: Monitoring and understanding changes in extremes: Extratropical storms, winds, and waves. Bulletin of the American Meteorological Society, in press, doi:10.1175/BAMS-D-12-00162.1. URL | Detail

  29. Wang, X. L., Y. Feng, G. P. Compo, V. R. Swail, F. W. Zwiers, R. J. Allan, and P. D. Sardeshmukh, 2012: Trends and low frequency variability of extra-tropical cyclone activity in the ensemble of twentieth century reanalysis. Climate Dynamics, 40, 2775-2800, doi:10.1007/s00382-012-1450-9. | Detail

  30. Wang, X. L., V. R. Swail, and F. W. Zwiers, 2006: Climatology and changes of extratropical cyclone activity: Comparison of ERA-40 with NCEP-NCAR reanalysis for 1958-2001. Journal of Climate, 19, 3145-3166, doi:10.1175/JCLI3781.1. URL | Detail

  31. Willett, K. M., P. D. Jones, N. P. Gillett, and P. W. Thorne, 2008: Recent changes in surface humidity: Development of the HadCRUH dataset. Journal of Climate, 21, 5364-5383, doi:10.1175/2008JCLI2274.1. | Detail

  32. Zhang, R., and T. L. Delworth, 2009: A new method for attributing climate variations over the Atlantic Hurricane Basin's main development region. Geophysical Research Letters, 36, 5, doi:10.1029/2009GL037260. | Detail

The National Climate Assessment summarizes the impacts of climate change on the United States, now and in the future.

A team of more than 300 experts guided by a 60-member Federal Advisory Committee produced the report, which was extensively reviewed by the public and experts, including federal agencies and a panel of the National Academy of Sciences.

United States Global Change Research Program logo United States Global Change Research Program participating agency logos